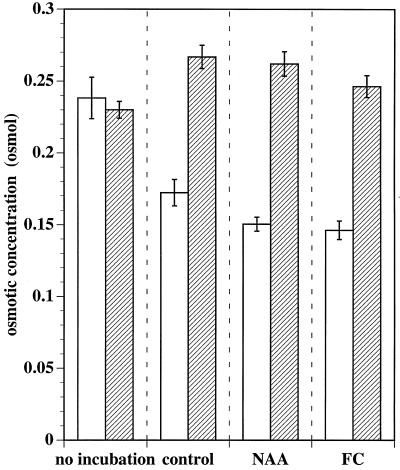
Figure 5.
Effect of absorbable solutes on the osmotic concentration of tobacco leaf strips. Strips (20–30 per sample) were either sampled immediately (no incubation) or first incubated for 20 h in 0.5 mm Mes/BTP, pH 6.0 (open bars, no solutes), alone (control), or also with 10 μm NAA or 1 μm FC. Alternatively, strips were incubated in 0.5 mm Mes/BTP, pH 6.0, augmented by 10 mm Suc and 10 mm KCl (striped bars, solutes) alone, with NAA, or with FC. The strips were patted dry, frozen, and thawed, and the osmotic concentration of their expressed sap was determined. Error bars indicate the 95% confidence limits for mean osmotic concentration (Student's t test; n = 20 samples per treatment).

