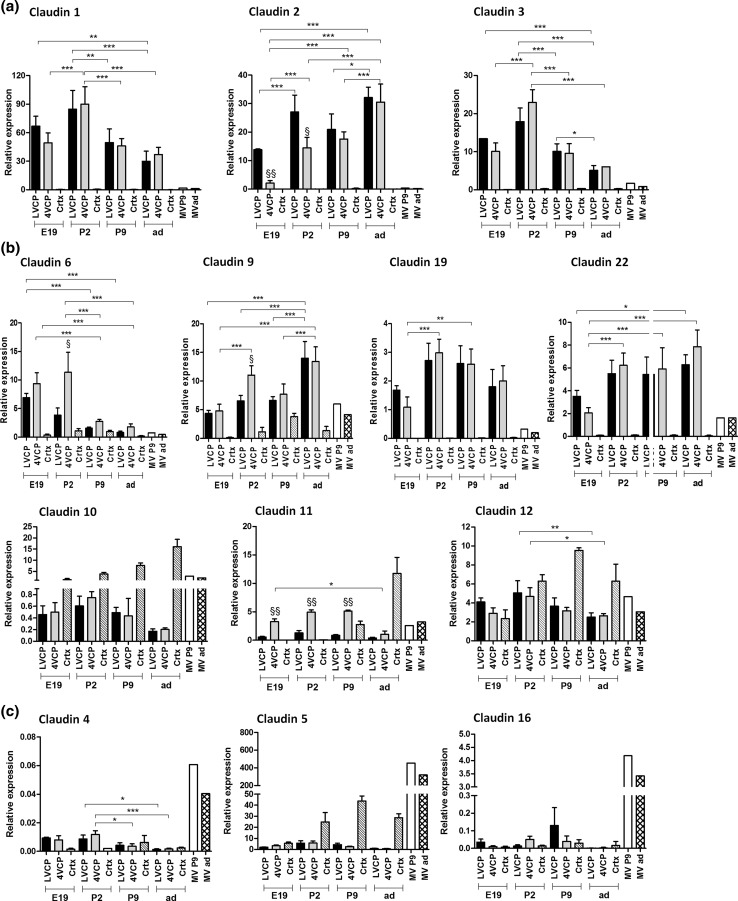
Fig. 1.
Developmental analysis of claudin transcript levels in choroid plexuses, cerebral cortex and cerebral microvessels of the rat. RT-PCR was performed on tissues sampled at four developmental stages. The results, expressed relative to the bacterial AraB gene added as an external standard, are shown as mean ± SD, n = 4, except for MV, for which values represent the mean of two preparations. Gene expression levels did not differ by more than 13.8 % between the two age-matched MV preparations. The results are expressed as arbitrary units, and are all normalized to the expression level found for Cld-1 in one sample of LVCP obtained from P2 animals, and set arbitrarily at 100 (see “Materials and methods” for details of calculations). a Clds displaying the highest specific expression in CP throughout development. b Clds expressed at lower, but significant levels in the CP by comparison to other brain preparations. Some displayed a strong specificity for the choroidal tissue. c Clds specifically enriched in the MV preparations, see “Results” for a detailed description of the data. *, **, ***Statistical differences in expression levels between developmental stages, analyzed by one-way ANOVA followed by a Tukey’s multiple comparison test, p < 0.05, 0.01, 0.001, respectively. For clarity, only differences observed for LVCPs and 4VCPs are shown on the graphs. §, §§Statistical differences in expression levels between age-matched 4VCPs and LVCPs, two-tailed paired Student’s t test, p < 0.05 and 0.01, respectively. Other relevant statistical analyses are stated in “Results”. LVCP and 4VCP choroid plexus of the lateral and fourth ventricle, respectively, Crtx cerebral cortex, MV cerebral microvessels, E19 19-day-old embryo, P2 and P9 2-day-old and 9-day-old, respectively; ad adult

