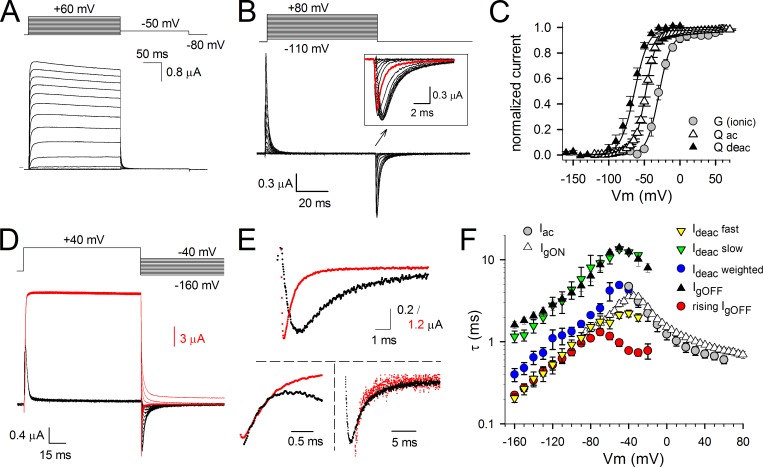
Figure 1.
Ionic and gating currents from Shaker-H4-IR; behavior of the VSD and channel gate. (A) Activating ionic currents (Iac) recorded from Shaker-H4-IR using the pulse protocol shown on top. (B) Gating current recordings after depletion of K+ and external TEA block. The holding potential was −130 mV, and oocytes were depolarized in 5-mV increments from −120 to 80 mV. Background leak and capacitive currents were subtracted with a −P/4 protocol using a −120-mV holding potential. The inset is a scaled-up view of the IgOFF currents highlighting the gradual slowing in IgOFF decay when prepulse depolarization voltages became stronger (red trace is IgOFF for a −50-mV pulse). (C) Voltage dependence of both activating and deactivating charge movement (QV curve) and BC gate opening (GV curve). The GV curve (circles) was obtained from the ionic tail currents during the repolarization step of pulse protocols shown in A. The voltage dependence of gating charge activation (QV curve displayed with open triangles; Qac) was obtained by integrating the repolarizing gating currents (IgOFF) of the activation protocol shown in B. The voltage dependence of gating charge deactivation was obtained by integrating the repolarizing gating currents of the deactivation protocol shown in D (QV curve displayed with closed triangles; Qdeac). Both GV and QV values were normalized, and the curves shown are for both GV and QV the average fit to a Boltzmann equation. (D) Superposition of scaled ionic (red traces) and gating currents (black traces) obtained from the same oocyte using the voltage protocol shown on top. Scale bars for gating and ionic currents are shown in black and red, respectively. (E, top) A scaled-up view of the overlapping deactivation ionic (Ideac) and gating (IgOFF) currents from D at −110-mV repolarizing voltage. (bottom) The respective Ideac and IgOFF currents were normalized and superimposed. On the left, the IgOFF is inverted to highlight the overlap of the fast component in Ideac with the rising phase observed in IgOFF. On the right, a scaled-up view of the slow component in Ideac that matches the IgOFF decay. (F) Voltage dependency of the time constants ± SEM of IgON decay (open triangles; n = 8), IgOFF decay (closed triangles; n = 7), the rising phase of IgOFF (red circles; n = 7), Iac (gray circles; n = 7), the fast component of Ideac (yellow inverted triangles; n = 7), the slow component of Ideac (green inverted triangles; n = 7), and the weighted Ideac kinetics (blue circles; n = 7). Note the superposition of the slow Ideac component with IgOFF decay and the fast Ideac component with the rising phase in IgOFF. Error bars represent SEM.

