Figure 2.
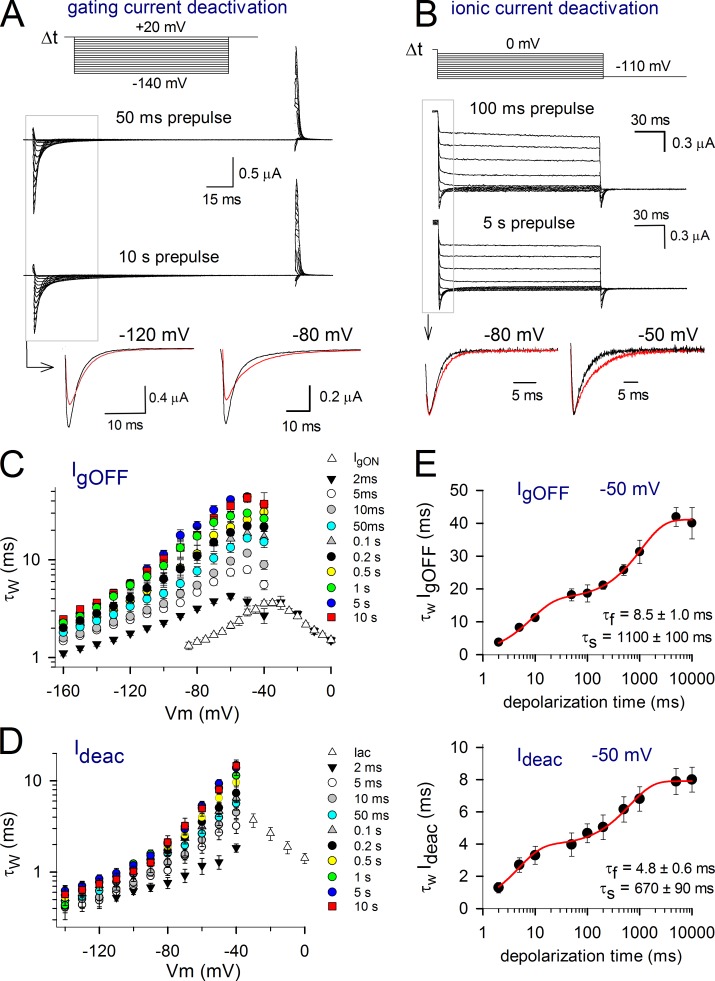
Slowing in IgOFF and Ideac kinetics of Shaker channels with prolonged depolarization. (A) Deactivating IgOFF currents upon different depolarization times at 20 mV. To avoid nonspecific effects or depletion effects, the pulse protocols were ran in random order, and, in the case of the represented currents, the protocol with a 10-s prepulse (bottom traces) was recorded before the 100-ms trace (top traces). (bottom) A superposition of IgOFF at different voltages upon 100-ms (black) and 10-s depolarizations (red). Note that IgOFF slows down and the total charge becomes more spread out when depolarizations are prolonged. (B) Ionic current deactivation after 100 ms (top traces) and 5 s (bottom traces) at 20 mV. (bottom) A superposition of scaled currents at −80 and −50 mV upon 100-ms (black) and 5-s (red) depolarizations. (C) IgOFF was fitted with a double exponential function, and the weighted time constants ± SEM are represented (n = 6). Note the gradual increase of the time constants with prolonged depolarization times. (D) Development of the ionic deactivation Ideac weighted time constant as a function of depolarization time, displaying, like IgOFF, a gradual slowing with prolonged depolarizations. (E, top) The weighted IgOFF time constant at −50 mV plotted as a function of depolarization time clearly displaying two slowing processes. The fit with a double exponential function yielded a fast τf of 8.5 ± 1.0 ms and a slow τs of 1,100 ± 100 ms (n = 6). (bottom) The behavior of Ideac kinetics at −50 mV showing a similar biphasic slowing process with a τf of 4.8 ± 0.6 ms and a τs of 670 ± 90 ms (n = 5). Error bars represent SEM.

