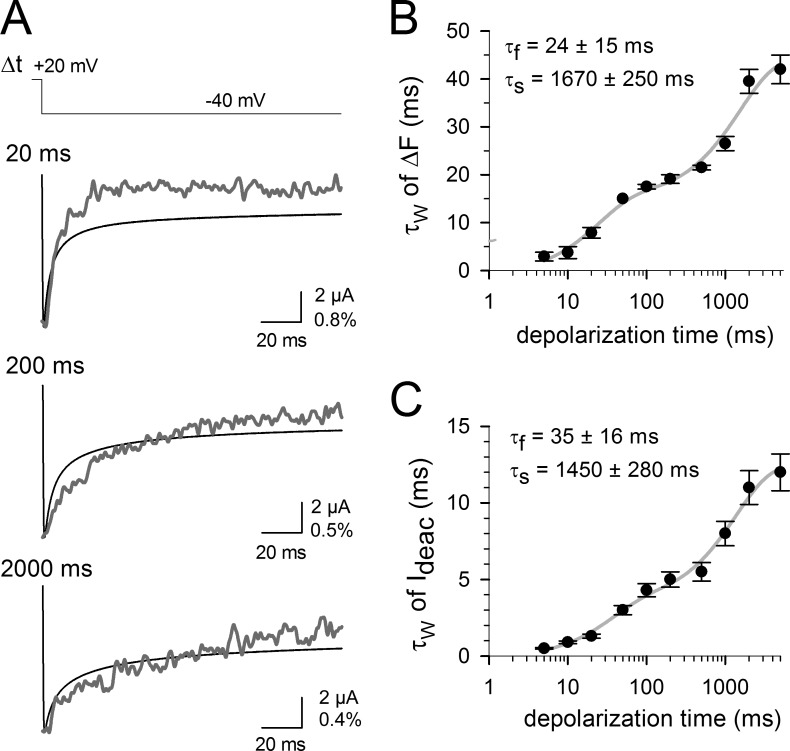
Figure 3.
Direct correlation between VSD and gate movement in the Shaker-M356C channel using site-directed fluorimetry. (A) Simultaneous recording of Ideac (black traces) and recovery of fluorescence quenching (ΔF, gray traces) from an oocyte expressing TMRM-labeled M356C Shaker channels using the indicated protocol and various prepulse durations at 20 mV. For clarity, both traces have been normalized. The vertical scale bar indicates both ionic current amplitude (in microamps) and ΔF/F (in percentage). (B) The kinetics of the fluorescence recovery signal obtained at −60 mV is shown as a function of the prepulse duration. Note that like the gating current recordings, there were two slowing process in the kinetics with prolonged membrane depolarizations. (C) Development of the weighted Ideac time constant at −60 mV as a function of depolarization time, displaying, like the simultaneously recorded ΔF signal, a biphasic slowing of the kinetics. Error bars represent SEM.

