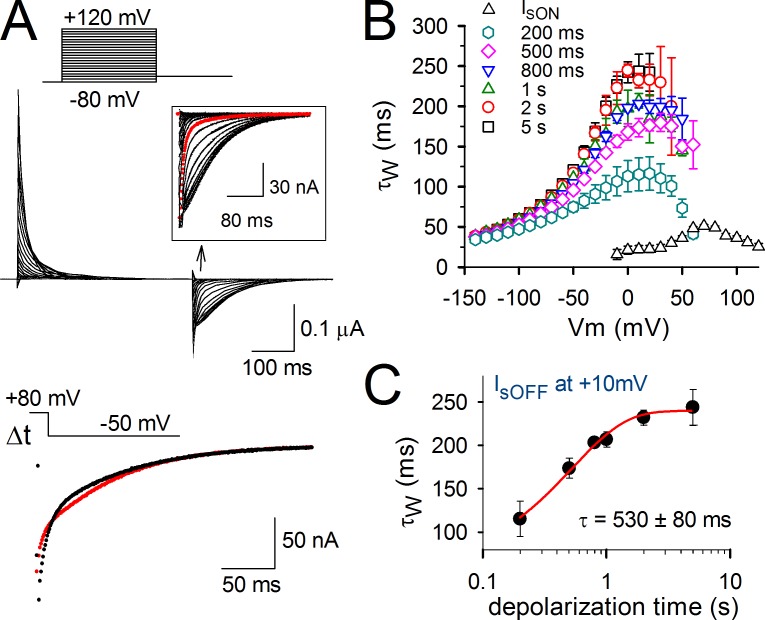
Figure 7.
Slowing in charge return of Ci-VSP sensing current Is. (A, top) Current tracings showing Is of Ci-VSP using the indicated activation protocol. The IsOFF from a moderate 30-mV test pulse is shown as the red trace in the inset. Note the rapid slowing down in IsOFF that accompanies the most positive depolarizations. (bottom) Current tracings are a superposition of IsOFF at −50 mV upon 200-ms (black) and 1-s (red) depolarizations to 80 mV. Note the slowing in IsOFF decay when depolarizations get prolonged. (B) Kinetics of activating IsON (open triangles) obtained in WT Ci-VSP from different activation voltage pulses (similar to the protocol shown in A) and of deactivating IsOFF obtained in WT Ci-VSP using 80-mV prepulses of the indicated durations from 200 ms to 5 s (colored symbols) and pulsing to different deactivation voltages. (C) The weighted time constant of IsOFF decay measured at 10 mV is plotted as a function of the duration of the conditioning prepulse. The obtained curve was fitted to a single exponential function and yielded a time constant of τ = 530 ± 80 ms (n = 7). Error bars represent SEM.

