
Figure 2.
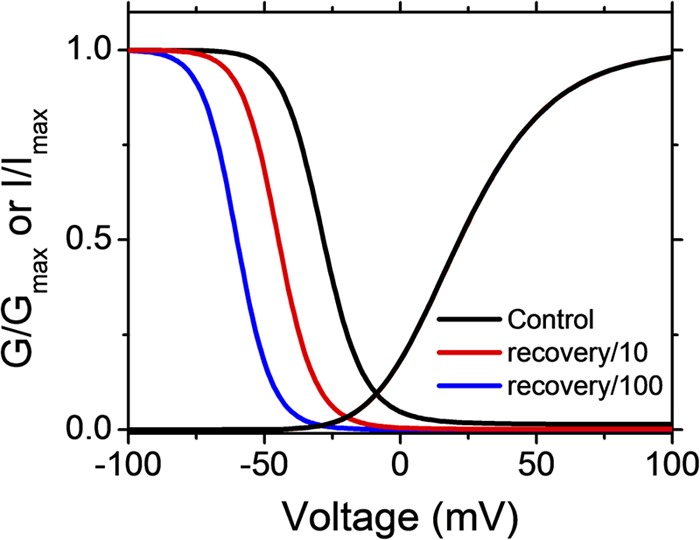
The effect of recovery from OSI on the simulated relationship between the GP-V and the steady-state inactivation curves. The GP-V and steady-state inactivation curves were simulated assuming OSI (Fig. S1 and Table S1) in three conditions that compare the effect of varying the rate constant of recovery from inactivation (λ1). Note that the steady-state inactivation curve shifts to the left as λ1 is slowed. In contrast, the GP-V curves superimpose exactly on each other.