Figure 3.
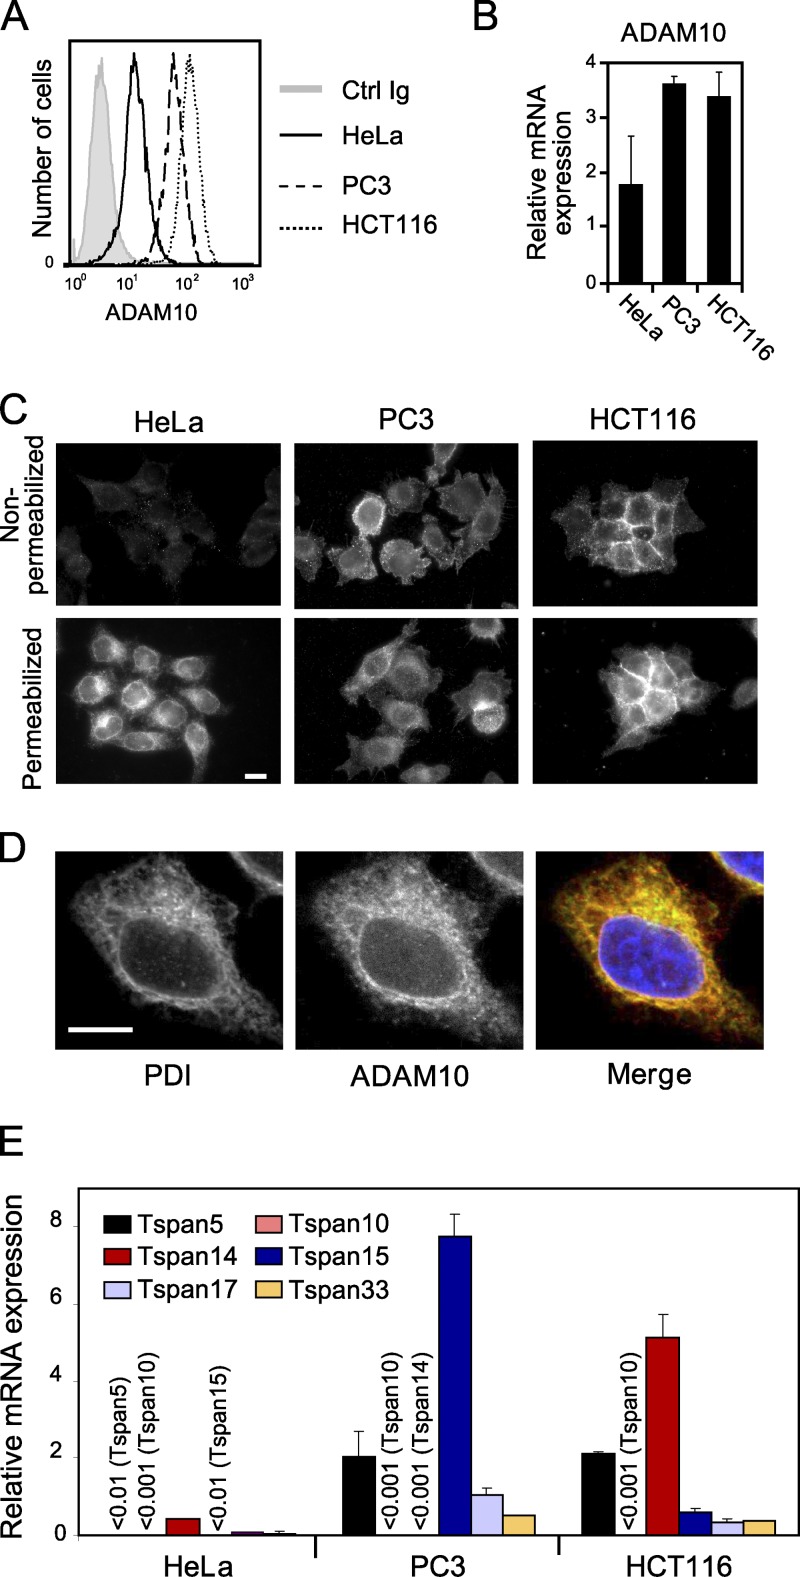
ADAM10 localization in the ER correlates with low TspanC8 levels. (A) Flow cytometric analysis of the surface expression of ADAM10 in HeLa, PC3, and HCT116 cells. (B) RT-qPCR analysis of ADAM10 mRNA levels in HeLa, PC3, and HCT116 cells. The figure shows the mean ± SD of three independent experiments performed in triplicate. (C) Surface and intracellular expression of ADAM10 in HeLa, PC3, and HCT116 cells. Cells grown on coverslips were fixed with paraformaldehyde and permeabilized or not with 0.1% Triton X-100 before staining. The acquisition settings were the same for all conditions. This experiment was repeated at least three times. Bar, 10 µm. (D) Confocal microscope analysis of ADAM10 (red) and PDI (green) distribution in HeLa cells permeabilized with 0.1% Triton X-100. This experiment was repeated at least three times. Bar, 10 µm. (E) RT-qPCR analysis of TspanC8 mRNA levels in HeLa, PC3, and HCT116 cells. The figure shows the mean ± SD of three independent experiments performed in triplicate.

