Figure 7.
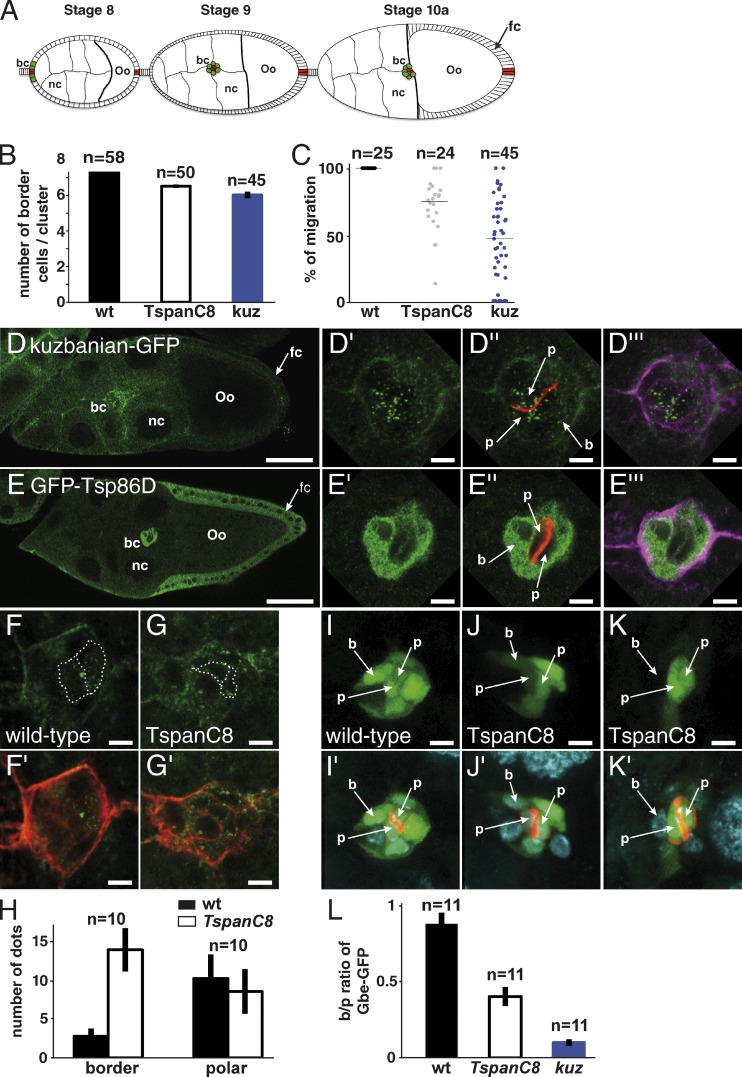
Regulation of Kuz distribution and Notch signaling in Drosophila oocytes. (A) Schematic representation of egg chambers at stages 8, 9, and 10a (oo, oocyte; nc, nurse cells). Border and polar cells are color coded in green and red, respectively (bc, border cells; fc, follicular cells). (B) In wild-type ovaries, migrating clusters contain 7.8 ± 0.1 border cells. The early silencing of Tsp3A, Tsp26A, and Tsp86D in border cells using slbo-Gal4 and c306 led to a reduced number of border cells (6.5 ± 0.1), similarly to kuz silencing (6.0 ± 0.2). (C) Plots showing the raw distribution of the relative distance covered by individual clusters along the migratory path at stage 10a. In wild-type ovaries, all clusters (n = 25) have completed their migration (distance covered: 100%). The silencing of kuz and TspanC8 resulted in a significant migration delay because clusters covered only 45 ± 26% and 75 ± 16% of the total distance, respectively, at stage 10a. (D–E′′′) Distribution of Kuz-GFP and GFP-Tsp86D (anti-GFP in green) in stage 9 egg chambers. Kuz and Tsp86D were expressed in migrating somatic cells consisting of two central polar cells (p; marked by Fas3, red in D′′ and E′′) surrounded by 6–8 border cells (b; outlined by actin, violet in D′′′ and E′′′). Kuz-GFP mostly localized into dots in polar cells but was diffusely distributed in border cells (D′–D′′′). Tsp86D was expressed in border cells (E′–E′′′) and in the somatic follicular cells (fc) around the oocyte. (F–G′) The silencing of TspanC8 in border cells, i.e., the triple Tsp3A, Tsp26A, and Tsp86D RNAi using slbo-Gal4, led to the redistribution of Kuz-GFP (green) into dots in border cells (G and G′; compare with control heterozygous Kuz-GFP in F and F′; actin, red). (H) Quantification of the Kuz-GFP dots in border and polar cells. The silencing of TspanC8 in border cells specifically increased the number of Kuz-GFP dots in these cells (14 ± 3 relative to 3 ± 1 in controls). No significant effect was seen in polar cells (9 ± 3 relative to 10 ± 3 in controls). (I–K′) Notch reporter gene activity (green; Fas3, red; DAPI, blue) was detected in border (b) and polar (p) cells (I and I′). TspanC8 silencing in border cells resulted in decreased Notch reporter activity. This effect varied from medium (J and J′) to strong (K and K′). (L) Ratiometric analysis of the GFP signal from the Notch reporter Gbe-GFP in migrating border cells relative to polar cells. The silencing of TspanC8 and kuz genes (as in I–K′) led to reduced border/polar ratios in GFP intensity (0.40 ± 0.06 and 0.10 ± 0.02, respectively; wild-type was 0.88 ± 0.07). Bars: (D and E) 40 µm; (all other panels) 5 µm.

