Figure 8.
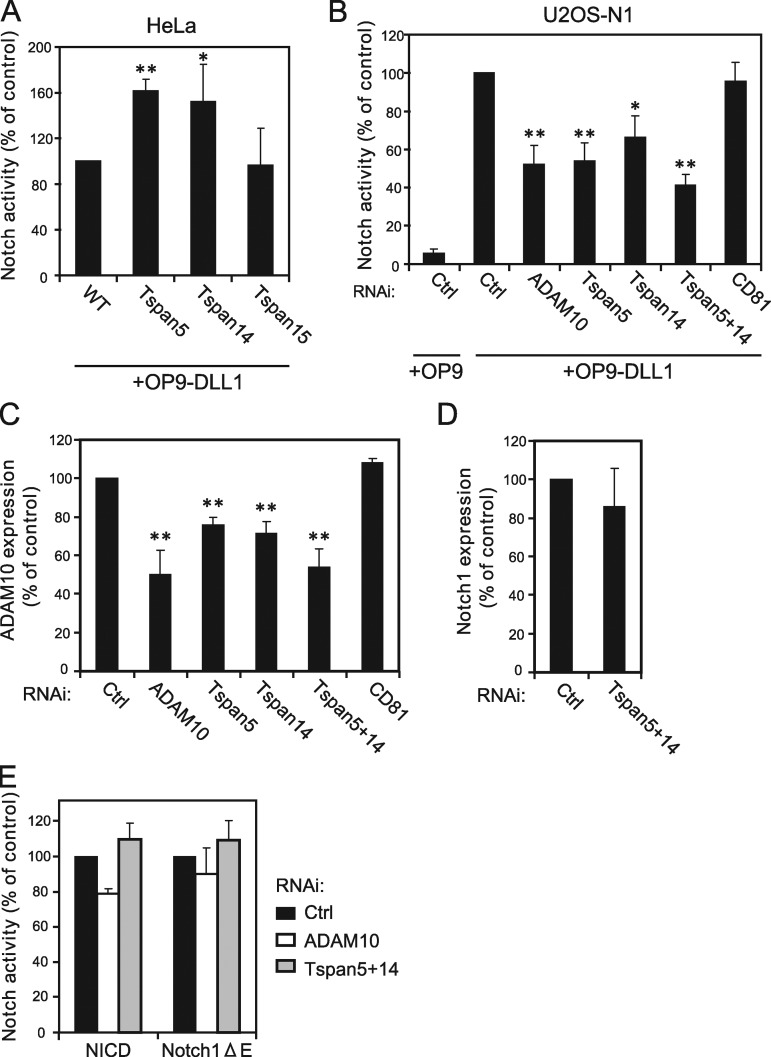
Tspan5 and Tspan14 regulate ligand-induced Notch activation. (A) Notch activity measured using a CSL reporter luciferase assay, of HeLa cells stably expressing or not Tspan5, Tspan14, or Tspan15. Notch was activated by incubation with OP9-DLL1 cells. The figure shows the mean ± SD of four independent experiments in duplicate. (B) U2OS-N1 cells were treated with the indicated siRNA before analysis of Notch activity produced by incubation with OP9 or OP9-DLL1 cells. The figure shows the mean ± SD of three independent experiments performed in duplicate. (C) Flow cytometric analysis of the surface expression of ADAM10 in U2OS-N1 cells treated with the indicated siRNA. The figure shows the mean ± SD of three independent experiments. (D) Flow cytometric analysis of the surface expression of Notch1 in U2OS-N1 cells treated with a control siRNA or siRNa directed to both Tspan5 and Tspan14. The figure shows the mean ± SD of three independent experiments. (E) U2OS-N1 cells were treated with the indicated siRNA and transfected with NICD and Notch1-ΔE constructs. Notch activity was determined using the luciferase assay. The figure shows the mean ± SD of three independent experiments performed in duplicate. **, P < 0.01; *, P < 0.05 as compared with control cells.

