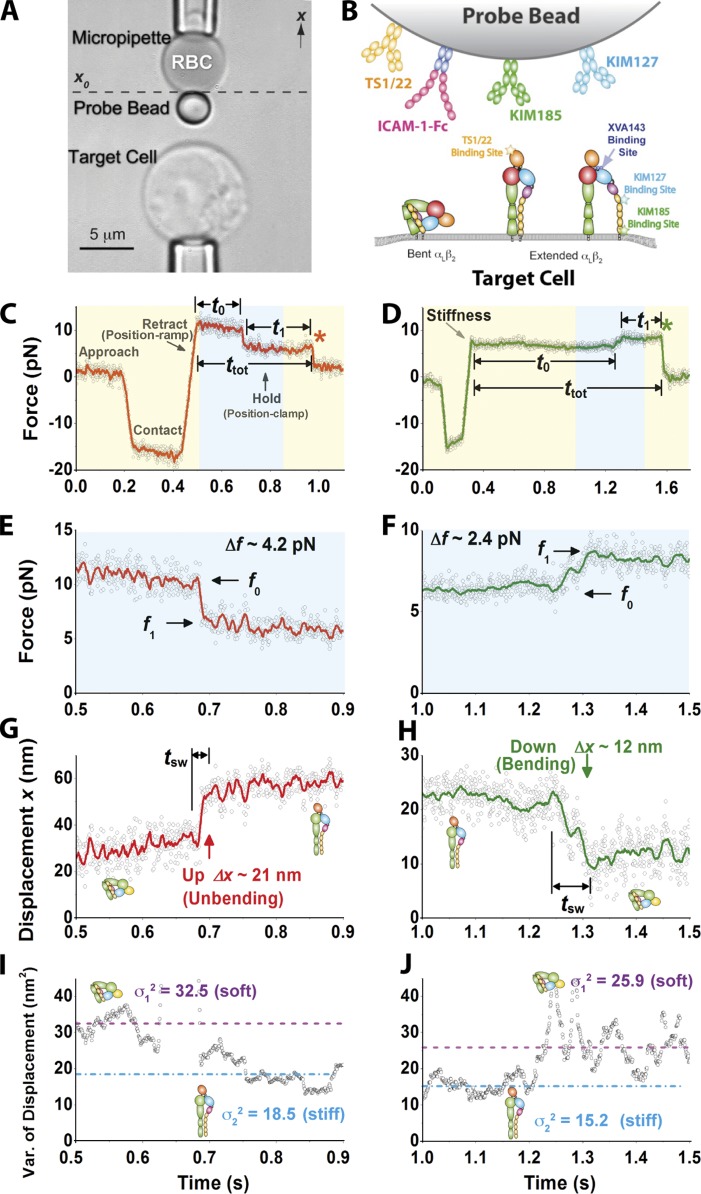
Figure 1.
Experimental setup of BFP for observing αLβ2 bending and unbending. (A) An RBC with a probe bead attached to the apex (top) was aligned against a target cell (bottom). The photomicrograph is rotated by 90°. (B) Composite of interacting molecules. Bent or extended αLβ2 was expressed on a target cell. ICAM-1–Fc or anti-αLβ2 was coated on the bead. Binding sites for anti-αLβ2 and XVA143 are indicated. (C–H) Representative force (C–F) and displacement (G and H) versus time plots showing a putative integrin unbending, or up (C, E, and G), and bending, or down (D, F, and H) event. Data (points) acquired at 1,600 fps exhibit significant thermal fluctuations depending on the stiffness of the system. Higher force and displacement resolutions were obtained after smoothing the raw data by the Savitzky-Golay method (curves). Displacement (Δx) and force (Δf) changes, pre/postchange forces (f0/f1), switching time (tsw), time to switch (t0), postswitching lifetime (t1), total lifetime (ttot), and dissociation (asterisks) are indicated. (C and D) The experiment was performed in repeated cycles; each cycle consisted of four phases indicated as approach, contact, retract (position ramp), and hold (position clamp). The zoom-in views of the cyan-shaded force versus time regions in C and D are shown in E and F and converted to displacement versus time curves in G and H using the equation f = k(x0 − x), in which k is the BFP stiffness, and x0 is the coordinate where the unstressed BFP probe bead is positioned (see A). (I and J) 100-point sliding variance of the displacement in G and H is plotted versus time to show molecular stiffness changes, manifested as a decrease (I) or increase (J) in BFP thermal fluctuations between high variance (dashed lines) and low variance (dashed dot lines) after unbending (I) or unbending (J). Putative αLβ2 conformations are depicted in G–J to help data interpretation.

