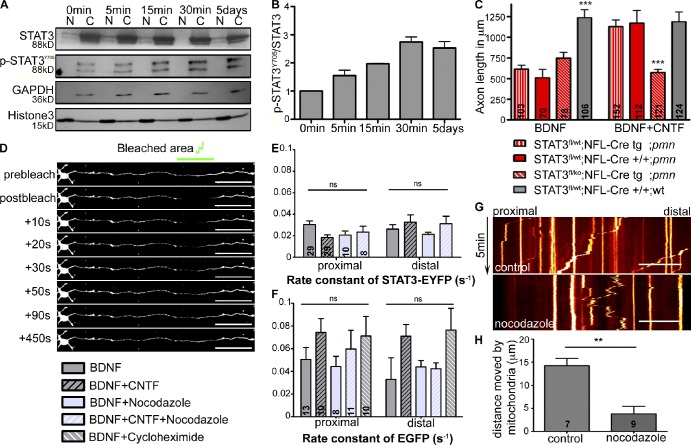
Figure 2.
STAT3 is essential for CNTF-mediated axon elongation. (A) Nuclear (N) and cytoplasmic (C) fractionation followed by Western blot analysis from primary motoneurons showing activation of p-STAT3Y705 upon CNTF stimulation. Activated STAT3 is mainly found in the cytoplasm at any time point investigated. Fractionation was controlled with GAPDH (cytosolic) and histone 3 (nuclear) as markers. (B) Quantification of activated p-STAT3Y705 in the cytoplasmic fraction of motoneurons after CNTF stimulation. n = 3 independent experiments. For each individual experiment, the 0-min data point was set to 1. (C) Loss of CNTF-mediated rescue of axon length in conditional STAT3 ablated pmn mutant motoneurons. Numbers in bars indicate number of cells measured. n = 3 independent experiments. Statistical analysis: ***, P < 0.001; ANOVA with Bonferroni posthoc test. (D) Representative images of a FRAP experiment performed on STAT3-EYFP–transduced primary motoneurons cultured for 6 DIV. The bleached axonal segment is marked by the green bar in the first top image. Fluorescence recovery is depicted at various time intervals as shown. For better representation of the montage, motoneuron topology was altered using ImageJ tool straighten. Bars, 100 µm. (E and F) Diffusion rates (s−1) of STAT3-EYFP and EGFP in lentivirally transduced primary motoneurons. Diffusion rates were obtained by curve fitting using one-phase decay function and least-square fit of normalized FRAP data (see Materials and methods). Numbers in bars indicate numbers of cells analyzed. n = 3 independent experiments. P > 0.05; Kruskal-Wallis with Dunn’s multiple comparison test. (G and H) Acute treatment with 10 µM nocodazole inhibits axonal transport of MitoTracker CMXRos–labeled mitochondria. (G) Representative kymograph of nocodazole-treated motoneurons showing reduced mobility of mitochondria. (H) Quantification of the maximal distance of mitochondrial movement within 5 min. n = 3 independent experiments. Numbers in bars indicate numbers of cells analyzed. Statistical analysis: **, P < 0.01; Student’s t test. Bars, 10 µm. Data shown represent means ± SEM.

