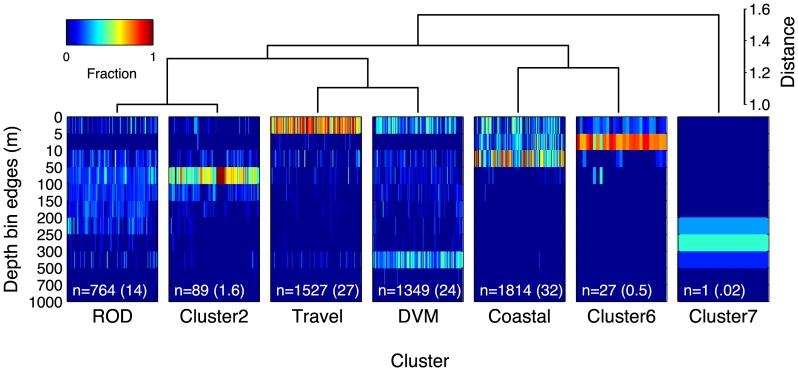
Figure 1. Dendrogram of white shark behavior, determined from clustering analysis of differences in diving patterns.
Each column represents a 24-hour depth histogram (n = 5571 days from 53 sharks) and is colored by fraction of time. Distinct vertical distribution patterning is evident in the grouping of days with similar depth distributions. The size of each cluster, is indicated by the number of days (n), and percent of total days (in parentheses). The density variable is expressed as a fraction of each day spent in depth bins defined along the y-axis.

