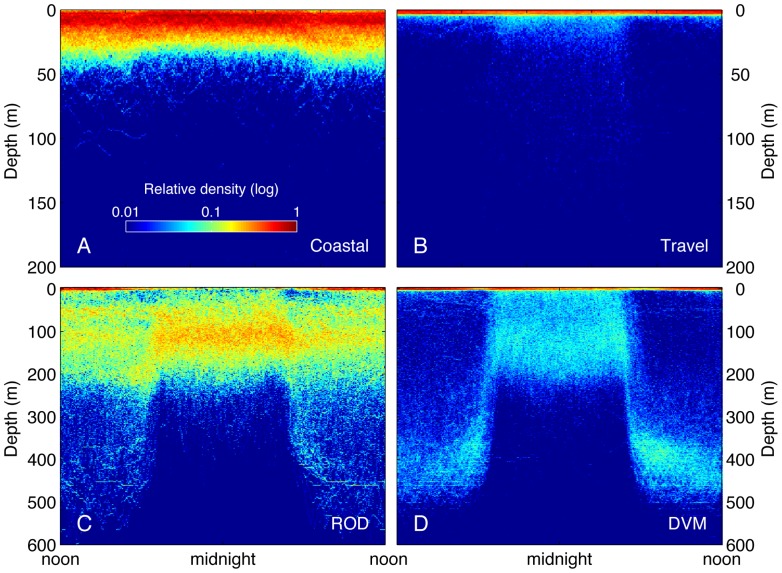
Figure 3. Diel patterns of white shark diving behavior from archival records queried by cluster.
High-resolution time and depth data were corrected for local time and aggregated by cluster over a 24-hour period. The relative density of data (log scale) is shown on a gridded surface for the four dominant clusters ‘Coastal’ (A), ‘Travel’ (B), ‘ROD’ (C), and ‘DVM’ (D) representing 97.9% of data. The clusters differed not only by overall daily depth distribution, but also in the diel pattern of depth occupancy. Note that a faint signal of DVM dive pattern can be detected in the other clusters. This is likely because sharks switched between behaviors at arbitrary times of day while the data were divided in regular 24-hour bins, resulting in some ‘bleeding’ of the behavior across clusters.

