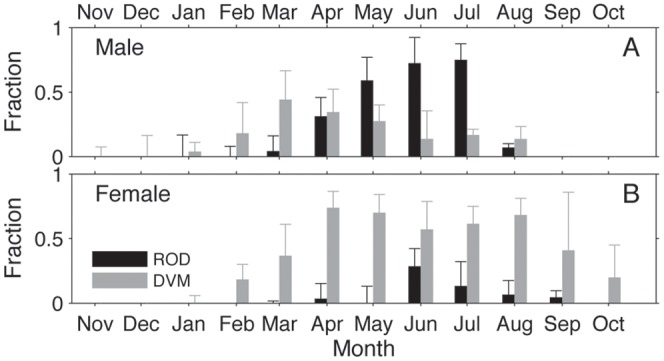
Figure 7. The fraction of time each month that male (A) and female (B) white sharks engaged in ‘ROD’ (black) and ‘DVM’ (grey) behavior.

The bars represent median values, while the error bars show the upper inter-quartile range among individuals.

The bars represent median values, while the error bars show the upper inter-quartile range among individuals.