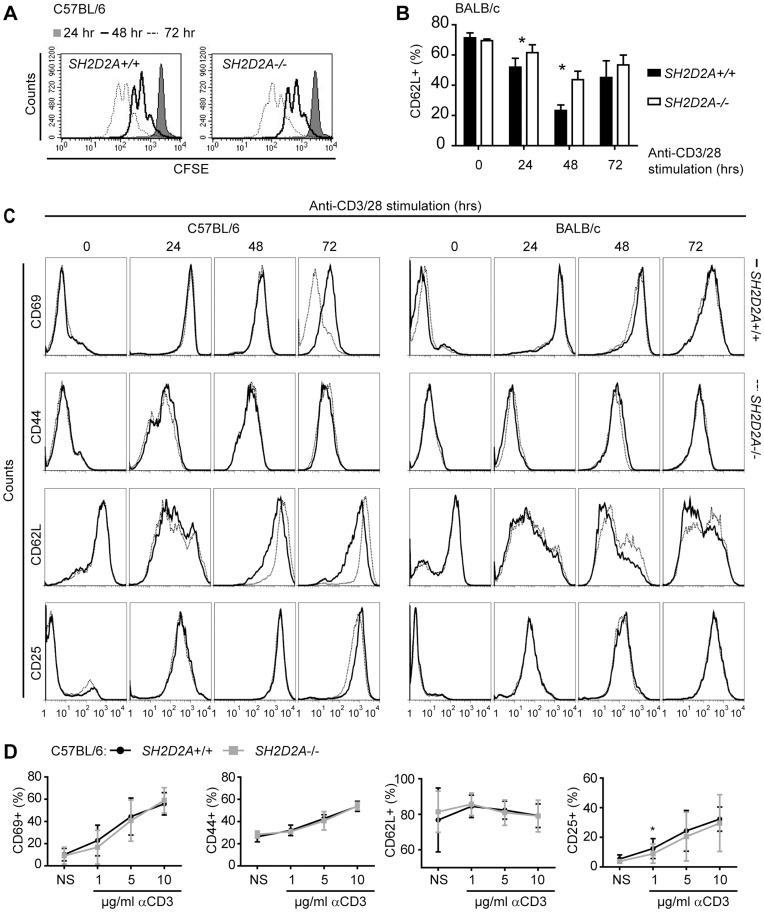
Figure 3. SH2D2A-deficiency does not have a major effect on anti-CD3/CD28 induced CD4+ T cell proliferation or expression of activation markers.
(A) CFSE labeled CD4+ T cells from wild-type (SH2D2A+/+) and SH2D2A-deficient (SH2D2A-/-) C57BL/6 mice were cultivated with anti-CD3/CD28 beads as described in materials and methods. After 24, 48 and 72 hours, cells were harvested and the CFSE dilutions of SH2D2A+/+ CD4+ T cells (left diagram) and SH2D2A−/− CD4+ T cells (right diagram) were measured by flow cytometry. Grey area - CFSE profiles after 24 hours, open area (black line) - CFSE profiles after 48 hours and open area (stippled line) - CFSE profiles after 72 hours in culture with anti-CD3/CD28 beads. (B, C) Unlabeled CD4+ T cells from SH2D2A+/+ and SH2D2A−/− C57BL/6 (C, left side) and BALB/c (B and right side of C) mice were cultivated as in A. Prior to and after 24, 48 and 72 hours, cells were stained with CD69, CD44, CD62L or CD25 mAbs to assess T cell activation. (B) The percentage of CD62L positive CD4+ T cells from BALB/c mice is shown after indicated time points of anti-CD3/28 bead stimulation. P values were calculated with unpaired t-test, *p < 0.05. (C) FACS plots gated on CD4+ T cells from one representative experiment of at least three is shown. Solid line – SH2D2A+/+ CD4+ T cells, dashed line - SH2D2A−/− CD4+ T cells. (D) CD4+ T cells from SH2D2A+/+ and SH2D2A−/− C57BL/6 mice were cultivated with 1 µg/ml soluble αCD28 mAb and either 1, 5 or 10 µg/ml plate-bound αCD3 mAb for 24 hours prior to staining with the indicated mAbs. The percentage of positive cells is shown as a function of µg/ml of stimulating αCD3 mAb. NS – non-stimulated.

