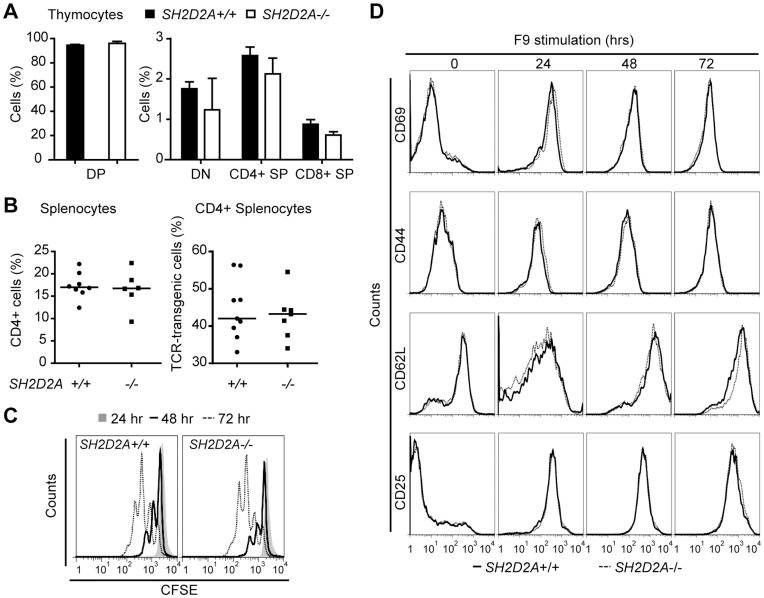
Figure 4. Characterization of SH2D2A-deficient Id-specific TCR-transgenic CD4+ T cells.
(A) Thymocytes from Id-specific TCR-transgenic mice with indicated genotypes (9–15 weeks old) were labeled with anti-transgenic TCR (GB113), anti-CD4 and -CD8 mAbs. Expression of CD4 and CD8 on GB113+ thymocytes was monitored by flow cytometry. The mean average percentage with SD of double positive (DP), double negative (DN), single positive (SP) GB113+ CD4+ and CD8+ thymocytes is indicated for each genotype (n = 3). (B) Splenocytes from normal (SH2D2A+/+) and age-matched SH2D2A-deficient (SH2D2A−/−) mice (6–14 weeks old) were labeled with anti-CD4 and GB113 and expression was monitored by flow cytometry. Diagrams show the frequency of CD4+ T cells (left diagram) and the percentage of CD4+ T cells that express the Id-specific transgenic TCR (GB113+) (right diagram). The median values are shown as lines in the diagrams. (C) CFSE labeled CD4+ T cells from TCR transgenic SH2D2A+/+ (upper diagram) and SH2D2A−/− (lower diagram) were harvested after 24, 48 and 72 hours in culture with Id-positive F9, labeled with GB113 antibody. The CFSE dilution in GB113+ CD4+ T cells was measured by flow cytometry; grey area - CFSE profiles after 24 hours, open area (black line) - CFSE profiles after 48 hours and open area (stippled line) - CFSE profiles after 72 hours. One representative experiment out of four is shown. (D) Unlabeled CD4+ T cells from SH2D2A+/+ and SH2D2A−/− mice were cultivated as in C. Prior to and after 24, 48 and 72 hours, cells were stained with GB113 in addition to CD69, CD44, CD62L or CD25 mAbs to assess T cell activation by flow cytometry. FACS plots gated on GB113+ CD4+ T cells from one representative experiment of at least three are shown.

