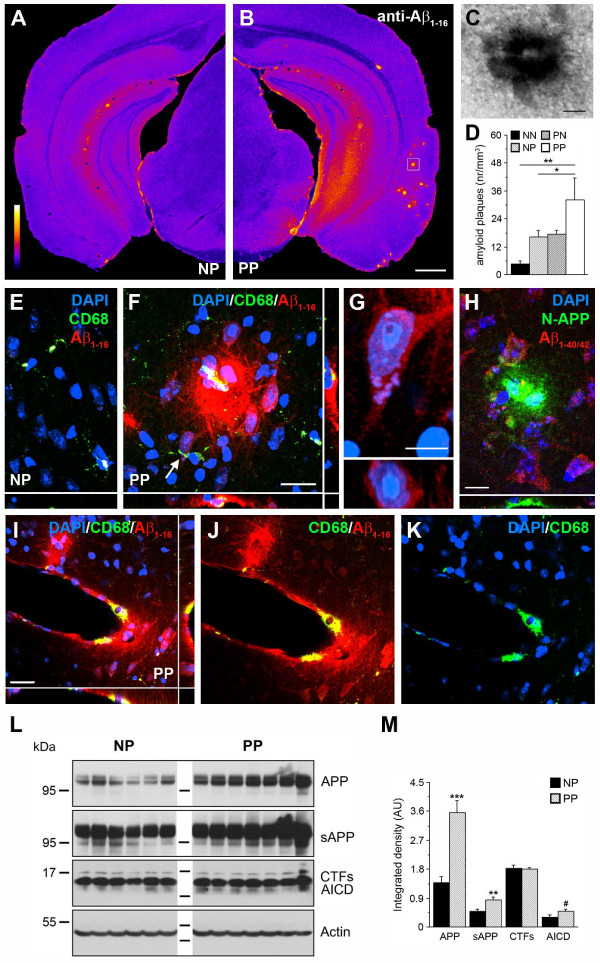
Figure 5.
An adult immune challenge induces amyloid precursor protein (APP) accumulation in non-transgenic mice prenatally exposed to polyriboinosinic-polyribocytidilic acid (PolyI:C). (A,B) Coronal brain sections of 15-month-old single (NP, NaCl at gestation day (GD)17, PolyI:C at 12 months) and double (PP, PolyI:C at both GD17 and 12 months) immune-challenged mice processed for anti-Aβ1–16 immunoperoxidase staining. Images are color-coded for visual display. (C) Enlarged view (box in B) of a representative precursor plaque. (D) Quantitative analysis of the numerical plaques density in all four treatment groups. Values are given as mean ± SEM, n = 6 to 7 per treatment. *P < 0.05, **P < 0.01; statistical significance based on ANOVA and Fisher LSD post-hoc analysis. (E-F) Confocal images captured in the entorhinal cortex of NP and PP brain sections processed for triple immunofluorescence staining. Activated microglia (CD68, green) were found in close vicinity to the plaques (anti-Aβ1–16) in PP mice. (G) Enlarged neuron in the entorhinal cortex (arrow in F) counterstained with DAPI (blue) displaying intracellular anti-Aβ1–16 IR (red). Bottom image shows confocal view along the xz axis. (H) Anti-N-terminal APP antibody (green) revealed strong accumulation of APP ectodomains in extracellular deposits located in the entorhinal cortex (PP mouse), whereas anti-Aβ1–40/42 (red) IR was seen only in surrounding neurons. (I-K) Pronounced accumulations of APP deposits (anti-Aβ1–16, red) in the cerebral vasculature in PP mice were associated with microglia (anti-CD68 antibody, green). Blue channel shows the DAPI nuclear counterstaining. (L) Western blots of hippocampal lysates obtained from 12-month-old NP and PP mice using anti-N-terminal and anti-C-terminal APP antibodies. (M) Quantitative analysis of the immunoreactive signals. Values represent mean relative optical density normalized to β-Actin and expressed in arbitrary units (AU) (mean ± SEM, n = 6 to 7). ***P < 0.001, **P < 0.01, *P < 0.05, #P = 0.08; statistics is based on Mann–Whitney U test. Scale bars: (B) = 500 μm, (C,F,I) = 20 μm, (G) = 5 μm, (H) = 10 μm.

