
Figure 2. A comparison of the methods for bias,  , and
, and  scaled by RMS of the predictions.
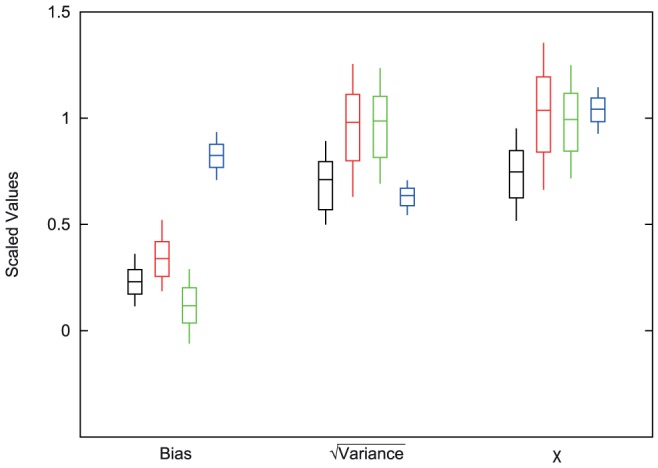
The center bars represent the calculated value for each of the methods. The top and bottom bars represent the 67% confidence intervals and the thin vertical lines extend to the 95% confidence intervals. The order of methods is Rosetta (black), FoldX (red), Eris (green), and iMutant3.0 (blue). For Rosetta, FoldX, and Eris the contributing factor for  appears to be the Variance, while I-Mutant3.0 seems to be affected more by the bias.