
Figure 3. A comparison of the  value with the RMSD datasets and RSA datasets scaled by RMS of the predictions.
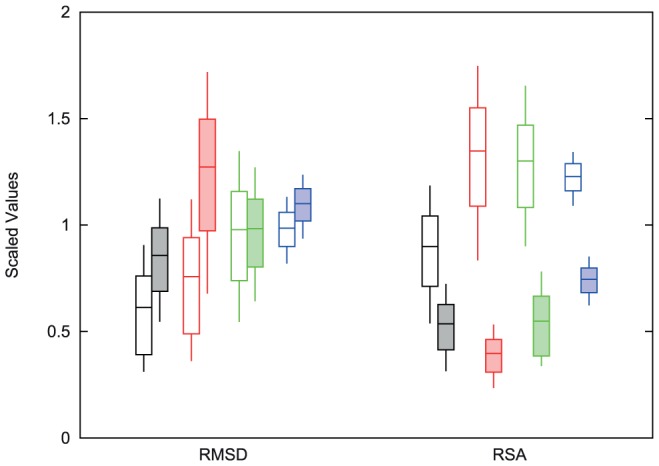
The center bars represent the calculated value for each of the methods. The top and bottom bars represent the 67% confidence intervals and the thin vertical lines extend to the 95% confidence intervals. The order of methods is Rosetta (black), FoldX (red), Eris (green) and iMutant3.0 (blue). The open RMSD bars represent those pairs of proteins with small changes in the two structures (RMSD ) and the shaded bars represent the pairs with larger changes. The open RSA bars represent those mutations that are buried within the protein (RSA
 ) and the shaded bars are those mutations that are more exposed. The RMSD split shows that Rosetta and I-Mutant3.0 do slightly better on structures with a lower RMSD value, while Eris performs equally as well on both sets. FoldX shows the most change between these two protein sets. All the methods perform better on exposed mutations than buried mutations, with Rosetta doing the best on buried and FoldX doing the best on exposed.