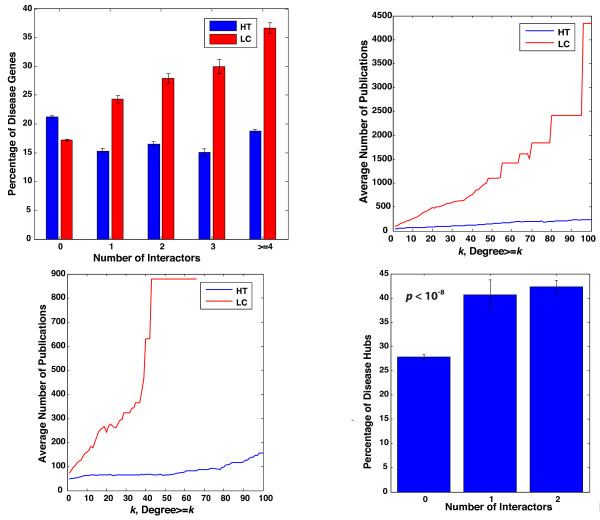
Figure 5.
A. Percentage of disease genes within proteins that have 0, 1, 2, 3, and > =4 interactions respectively. B. Plot of average number of publications associated with a protein versus the cumulative degree of the protein in the HT and LC interaction networks in human. C. Plot of average number of publications associated with a protein versus the cumulative degree of the protein in the HT and LC interaction networks in S. cerevisiae. D. Percentage of disease hubs within disease genes that have 0,1, and > =2 interactions respectively.

