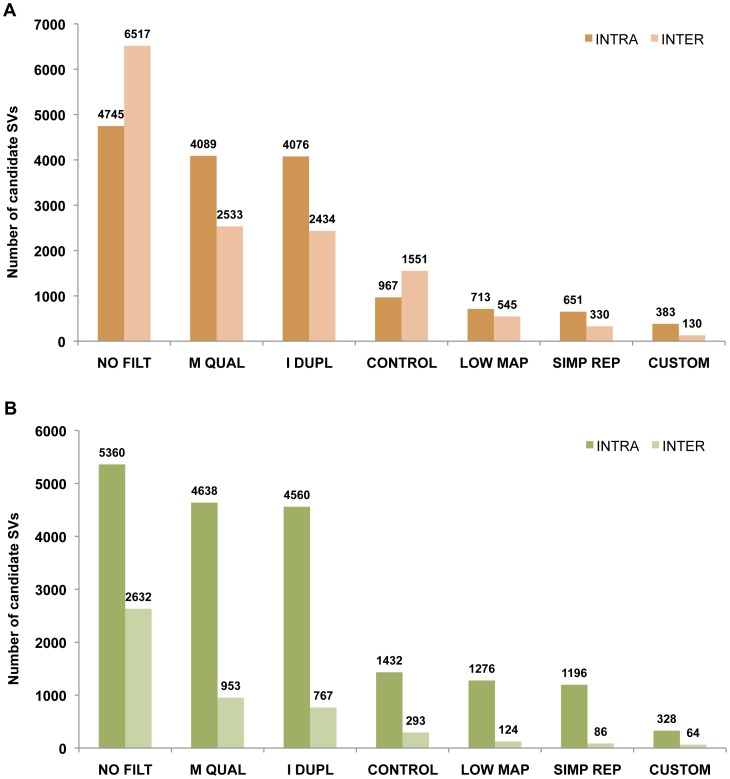
Figure 3. Tumor-specific SVs: data filtering.
Graph shows total number of SV calls by SVDetect (A) or BreakDancer (B), as consecutive filtering steps are applied. NO FILT- No filtering (except removal of perfect PCR duplicates and reads with zero BWA mapping quality), M QUAL- Removing reads with <23 BWA mapping quality, I DUPL- Removing reads in the category of “imperfect duplicates”, CONTROL- Comparing tumor dataset to the control, LOW MAP- Post-SV detection filtering of calls overlapping low mappability regions, SIMP REP- Post-SV detection filtering of calls overlapping simple repeats, CUSTOM- Custom filtering of remaining calls based on the rearrangement type (see text for details).

