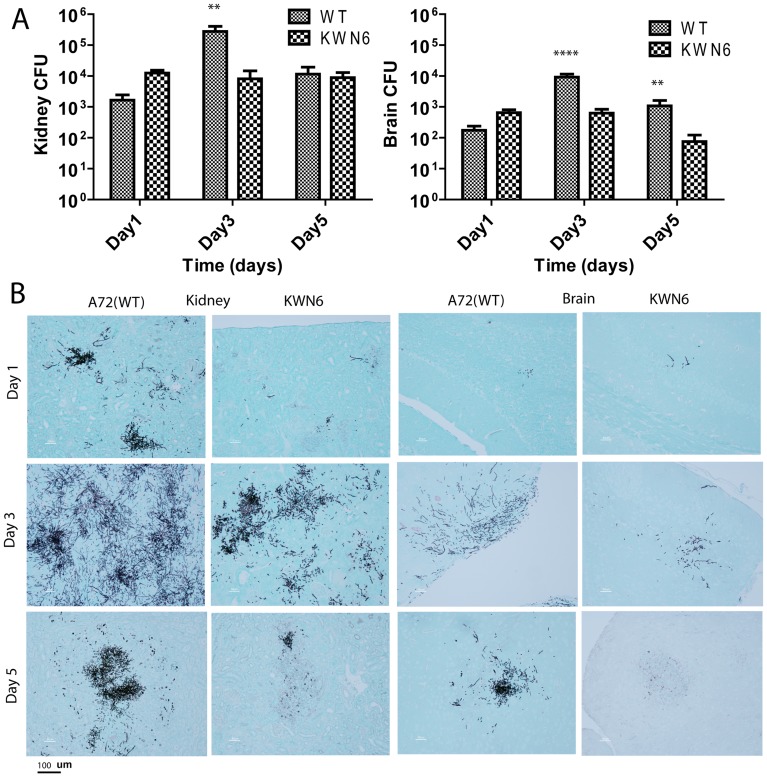
Figure 2. Dur1,2p expression promotes kidney and brain colonization.
(A). Kidney and brain fungal burdens of mice infected with parental A72 and mutant KWN6 strains. Gray bars represent mean CFU of WT infected left kidney homogenates determined by CFU on BiGGY agar from six representative serial dilutions from each kidney, representing three mice per time point infected. Checkered bars represent similar mean values for mice administered with KWN6. (B) GMS-stained mouse kidney and brain tissues to determine C. albicans colonization. Representative kidney and brain sections harvested day 1, 3 and 5 PI from mice infected with WT or KWN6 are shown. Scale bar indicates 100 μm.

