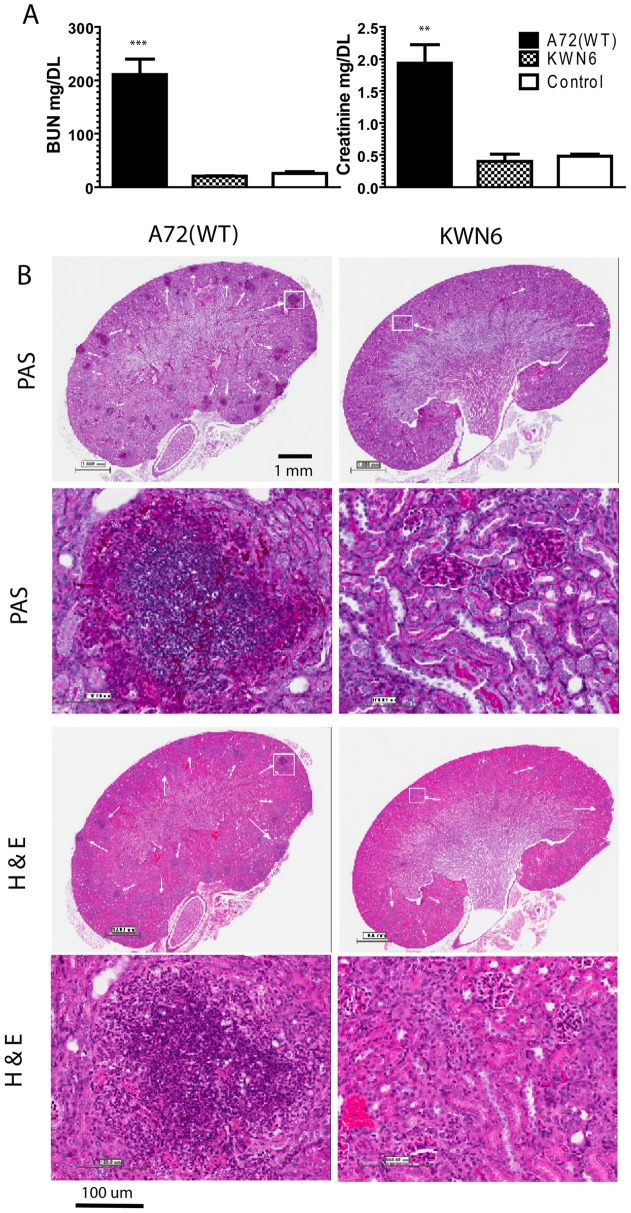
Figure 3. Dur1,2p expression impairs kidney function and increases inflammation.
A. Kidney function tests of mice infected with A72 (WT) vs KWN6 at day 3 PI. Open bars represent serum levels of BUN and creatinine in non-infected control mice. Checkered bars represent KWN6 infected mice, and closed bars represent A72 (WT) infected mice. Note the levels of BUN and creatinine are significantly higher in WT infected sera compared with KWN6 infected mice. B. PAS and H&E-stained mouse kidney tissues to assess inflammatory responses and tissue necrosis caused by C. albicans colonization. Representative sections of infected mouse kidneys (group of 3 mice) harvested at day 3 PI are shown. Scale bars indicate magnification. Arrows indicate regions of PMN and C. albicans accumulation in PAS stains and PMN inflammatory foci in H&E stains. Demarcated regions by white squares are shown under higher magnifications in the lower panels.

