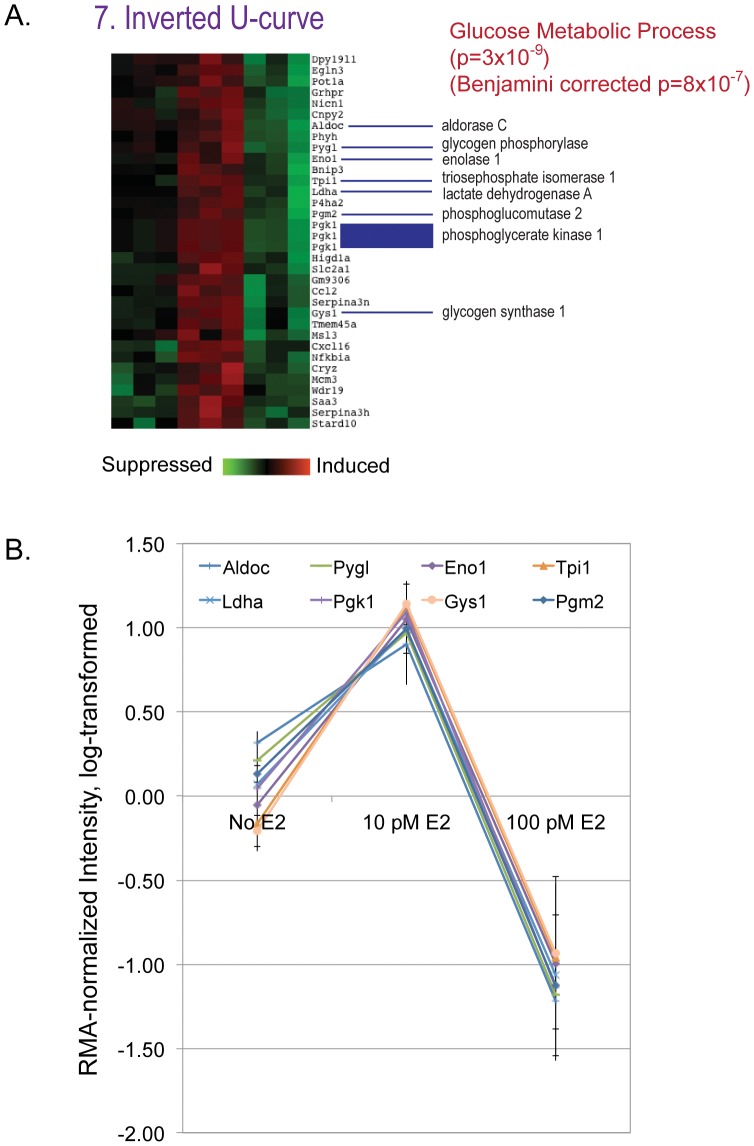
Figure 4. Detail of E2-suppressible genes in groups separated by clustering analysis.
A) Set 7: Inverted U-curve. Both raw p values and Benjamini-Hochberg corrected p values are given. B) Genes identified as part of the glucose metabolic pathway in panel A depicted as relative values to illustrate the high association between dose and gene expression.

