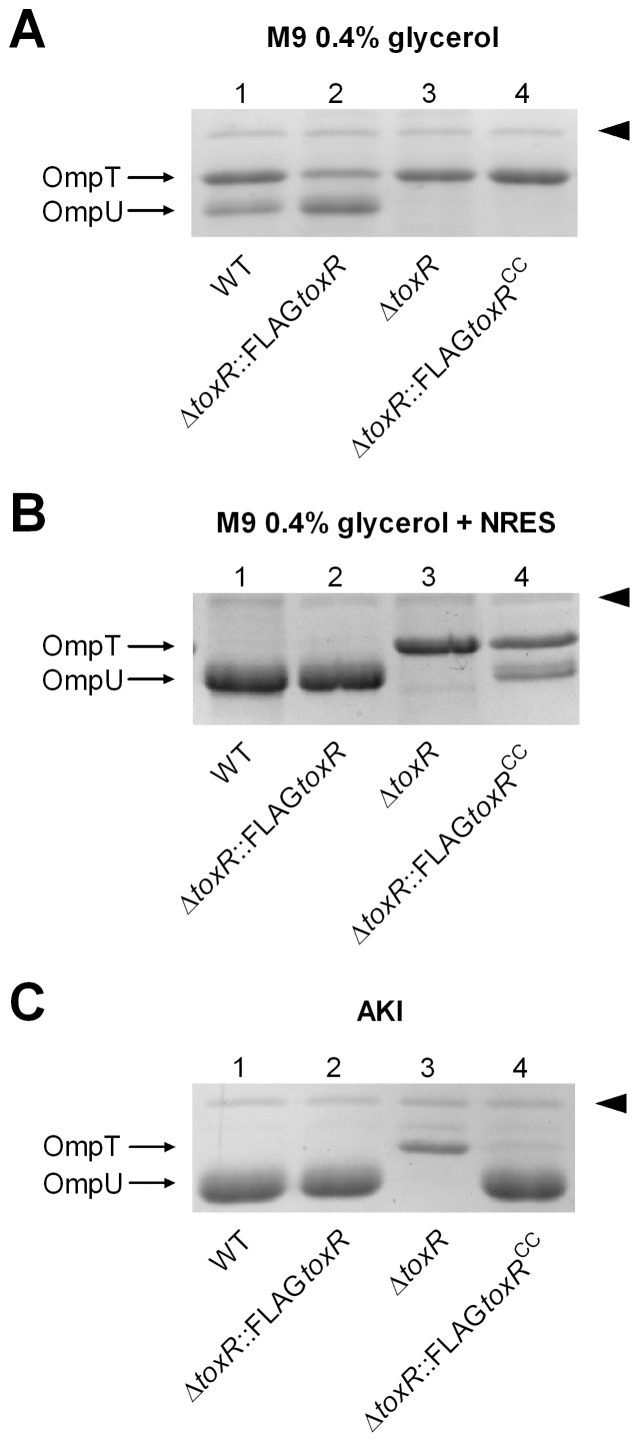
Figure 4. Chromosomal expression of FLAGtoxR and FLAGtoxRCC and porin regulation.
Panel A, B and C, shown are OMP profiles derived from OM preparations, representing WT, ΔtoxR::FLAGtoxR, ΔtoxR and ΔtoxR::FLAGtoxRCC strains, grown to stationary phase in M9 glycerol (A), M9 glycerol NRES (B) and AKI (C) during the anaerobic growth phase, respectively. Arrows mark OmpU and OmpT. Arrowheads on the right indicate a ToxR independent protein band used as loading control.

