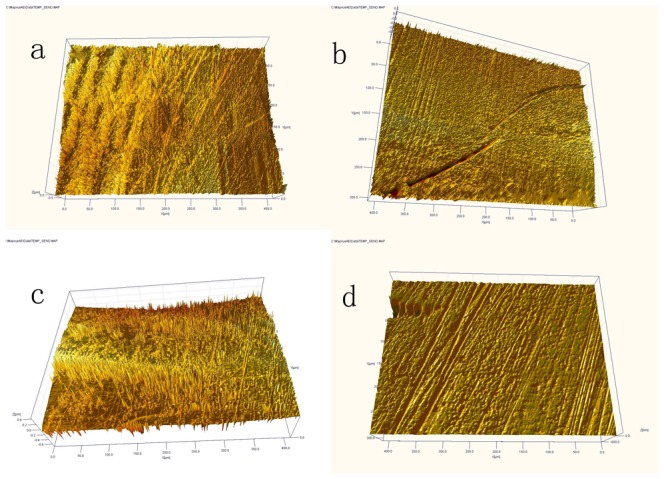
Figure 7. 3D profile micrographs from the center of the wear zone of the femoral head (a) and cup (c) in control group after 3MC wear test.

More protein deposition, shallow grooves, less wear. 3D profile micrographs from the wear zone of the femoral head (b) and cup (d) in experimental group after 3MC wear test. Less protein deposition, deeper grooves, more wear.
