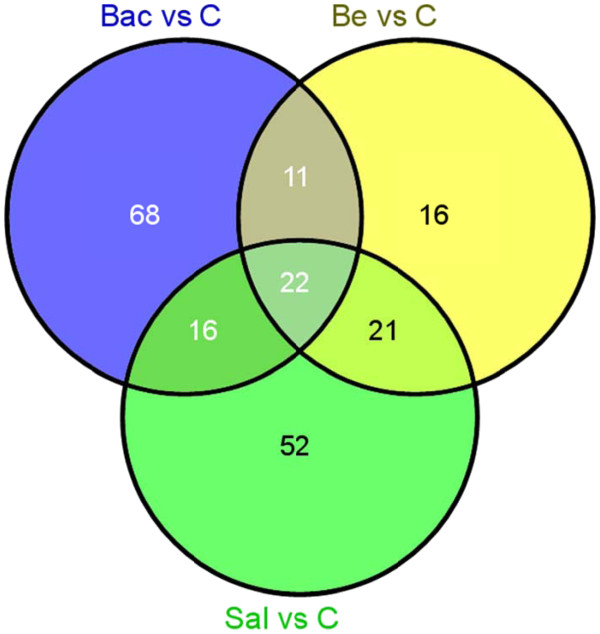
Figure 5.
Effects of specific immunostimulants on gene expression. Pairwise comparisons identified sets of transcripts differentially regulated between saline-, bead-, bacteria-injected bees and control bees in both colonies. A Venn diagram demonstrates that there is considerable overlap in the effects of each treatment, but also treatment-specific effects on gene expression. The numbers represent the number of genes in each category.

