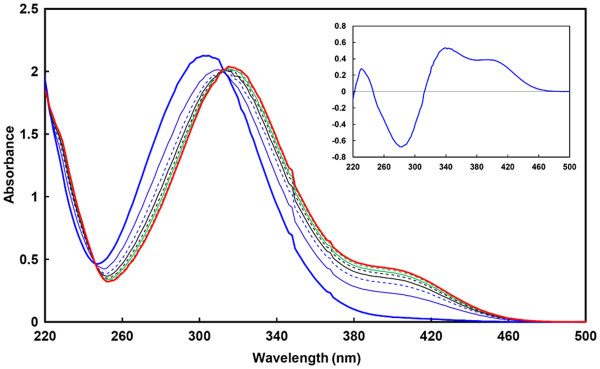
Figure 2.

UV–vis spectra ofp-NP-Neu5Ac upon hydrolysis by the purified sialidase NanA. Spectra were recorded for 232 μM pNP-Neu5Ac alone (thick blue line) and after 1 (thin blue line), 2 (dashed blue line), 3 (black line), 4 (dashed black line), 5 (green line), 7 (dashed green line) and 15 min (thick red line) incubation in the presence of 100 nM NanA. The reaction was complete after 15 min and the spectra did not change upon further incubation. Inset. Difference spectrum between intact and hydrolyzed p-NP-Neu5Ac, showing the variation in the spectrum: the appearance of a signal at 400 nm and a red-shift of the main peak from ~300 to ~315 nm.
