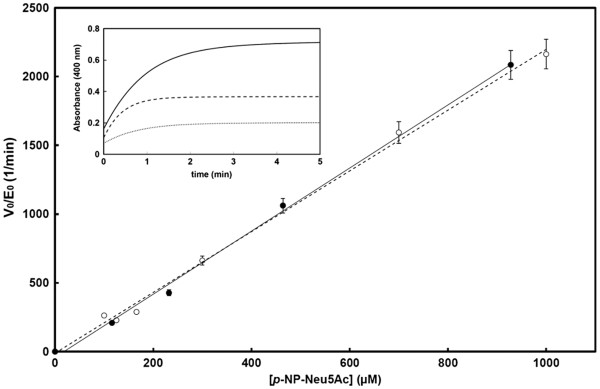
Figure 3.

Henri-Michaelis-Menten plot for the hydrolysis ofp-NP-Neu5Ac by NanA. The normalized initial rates (V0/E0) are plotted as a function of substrate concentration, showing the perfect agreement between the initial rates measured with the conventional indirect method (empty circles) and our direct method (black circles). Reactions followed a first-order kinetics. Inset. An example of complete hydrolysis time course of 116, 232 and 464 μM p-NP-Neu5Ac (dotted, dashed and plain line, respectively) by 100 nM NanA, which allowed to compute the catalytic efficiency as described by DeMeester et al.[18]
