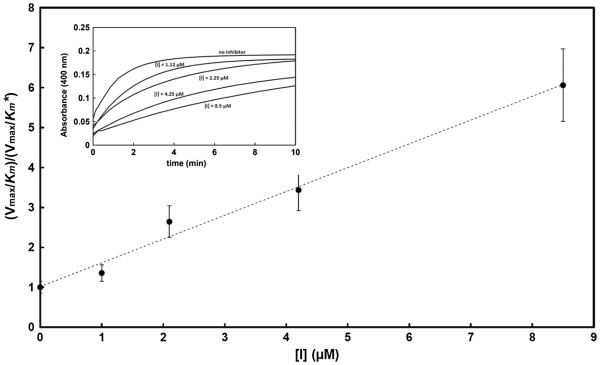
Figure 4.

Inhibition of NanA by the sialidase inhibitor Neu5Ac2en. The graph shows the dependence of the (Vmax/Km)/(Vmax/Km*) ratio as a function of the inhibitor concentration. The Vmax/Km* values were computed from the complete time-course reactions recorded in the presence of increasing concentrations of inhibitor and using 232 μM p-NP-Neu5Ac as the reporter substrate.
