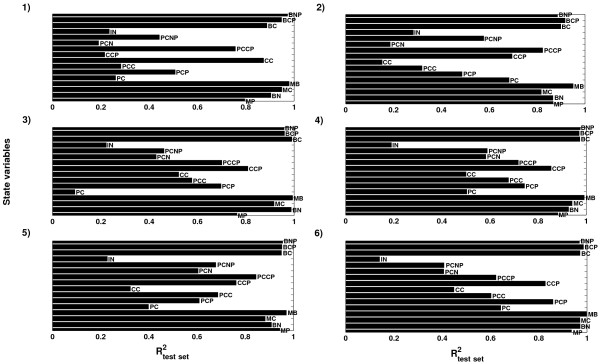
Figure 10.
Prediction results from hierarchical classical metamodelling within each regional regression model in the N-way HC-PLSR. The R2-values from test set prediction of the state variable trajectories from the parameters are shown for regional model 1–6, corresponding to the clusters used in the N-way HC-PLSR. All regional models use 9 NPLSR factors. The same clusters as in the inverse metamodelling were used.

