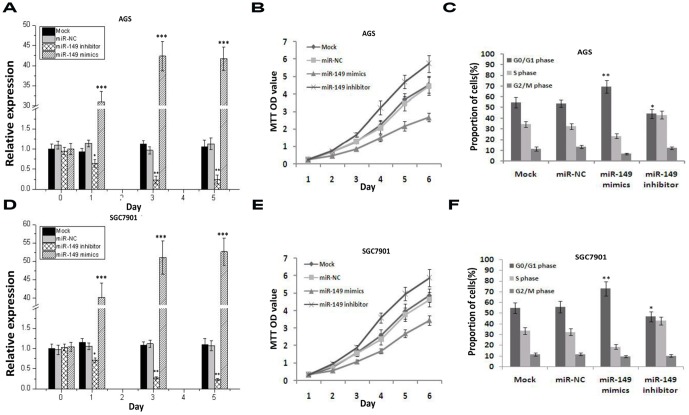
Figure 2. Expression of miR149 inhibits proliferation and induces G0/G1 arrest of GC cell lines.
A&D. The level of miR149 was measured by quantitative PCR at designated time (One-way ANOVA analysis, the values indicate the mean ± SEM, fig. 2A, F = 8.429, p = 0.003; fig. 2D, F = 8.595, p = 0.003). B&E. GC cells transfected with miR-149 mimics and inhibitor subjected to MTT assay daily for 6 days (Two-way ANOVA analysis, fig. 2B, F = 27.47, p<0.001; Fig. 2E, F = 44.061, p<0.001). C&F. GC cells cells transfected with miR-149 mimics and inhibitor were collected for FACS analysis after 72 h (The values indicate the mean ± SEM, n = 3, One-way ANOVA, fig. 2C, F = 134.177, p<0.001; Fig. F, F = 58.792, p = 0.003).

