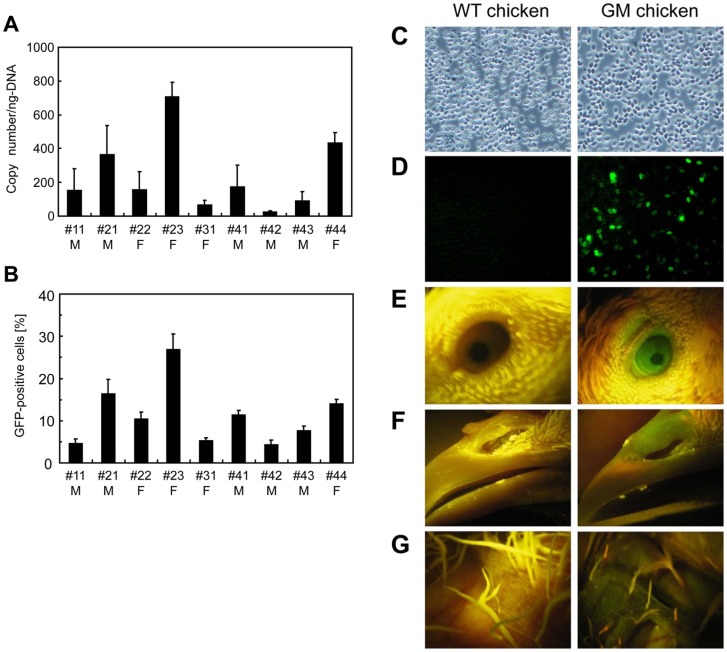
Figure 2. Transgene analysis of GM chickens.
(A) Mean copy number of the transgene. Quantitative real-time PCR analysis was performed to determine the mean copy number of transgenes in blood cells from GM chickens. Samples were prepared and assayed in triplicate. M, male; F, female. (B) Percentage of GFP-positive cells in the blood of GM chickens. M, male; F, female. (C, D) Observation of blood cells (C, phase contract; D, green fluorescence image). Left panels, wild-type chicken; right panels, GM chicken. (E–G) Detection of EGFP expression (E, eye; F, beak; G, skin).

