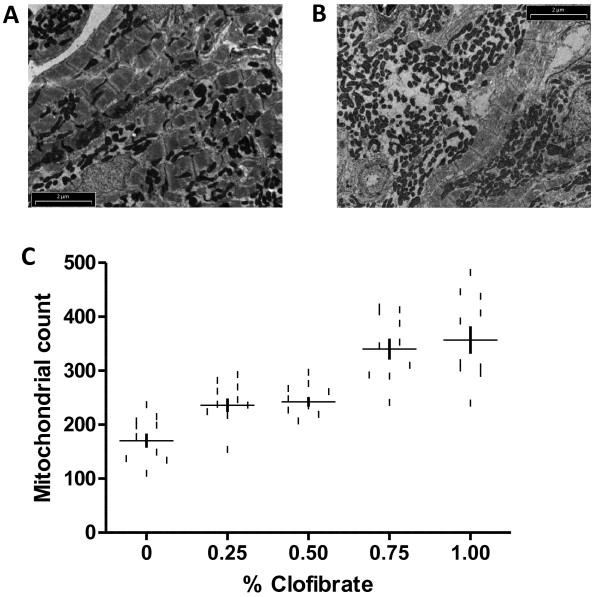
Figure 2 .
Electron micrographs of heart cells of zebrafish after clofibrate treatment. Mitochondria in the heart cells of zebrafish fed 0% clofibrate (A) and 1.00% clofibrate (B). Number of mitochondria per field of view in heart increased with increasing concentration of clofibrate fed zebrafish (C). Bar = 2 μm.

