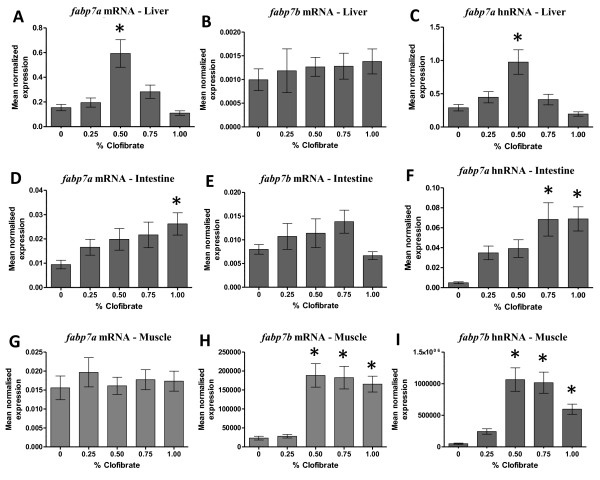
Figure 5 .
The steady-state level of fabp7a/fabp7b mRNA and hnRNA in liver (A, B, C), intestine (D, E, F) and muscle (G, H, I) of zebrafish fed clofibrate. The level of mRNA and hnRNA was determined by RT-qPCR using gene-specific primers. The steady-state level of fabp transcripts was normalized to the steady-state level of rpl13α transcripts in the same sample. Data are presented as the mean ratio ± S.E.M. Significant differences (p < 0.05) in the relative steady-state level of fabp mRNAs between zebrafish [n = 12, (male = 6, female = 6)] fed different concentrations of clofibrate compared to zebrafish not fed clofibrate are indicated by an asterisk.

