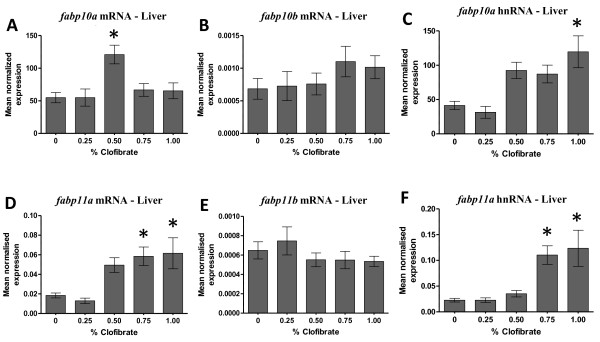
Figure 6 .
The steady-state level of fabp10a/fabp10b mRNA and hnRNA in liver (A, B, C) and fabp11a/fabp11b (mRNA and hnRNA) in liver (D, E, F) of zebrafish fed clofibrate. The level of mRNA and hnRNA was determined by RT-qPCR using gene-specific primers. The steady-state level of fabp transcripts was normalized to the steady-state level of rpl13α transcripts in the same sample. Data are presented as the mean ratio ± S.E.M. Significant differences (p < 0.05) in the relative steady-state level of fabp mRNAs between zebrafish [n = 12, (male = 6, female = 6)] fed different concentrations of clofibrate compared to zebrafish not fed clofibrate are indicated by an asterisk.

