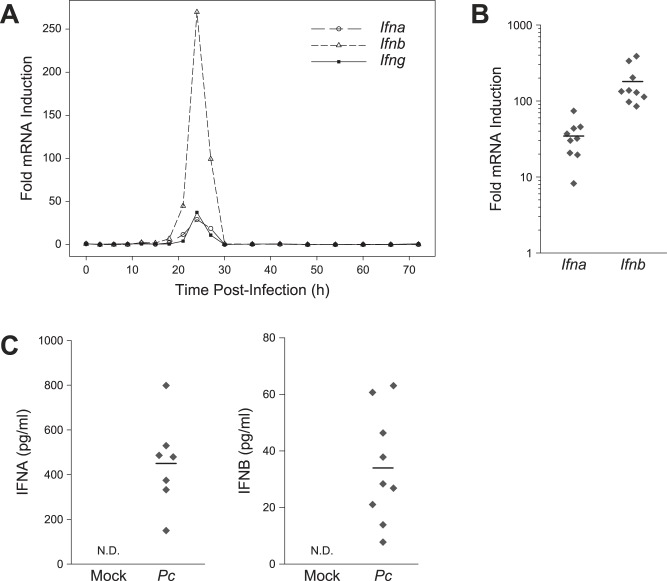
Figure 2. T1IFNs are produced during P. chabaudi infection.
(A) Kinetics of early Ifna, Ifnb, and Ifng transcription using whole spleen qRT-PCR. Fold mRNA induction represents the ratio of transcript in infected over mock-infected C57BL/6 mice. (B) Reproducibility of T1IFN transcript induction as detected by whole spleen qRT-PCR. Each point represents an independent experiment with 4–6 animals, with horizontal bars displaying the geometric mean. (C) Plasma IFNA and IFNB at 24 h post-infection. Data are combined from two independent experiments with each point representing one animal. N.D. = not detected (n = 8).

