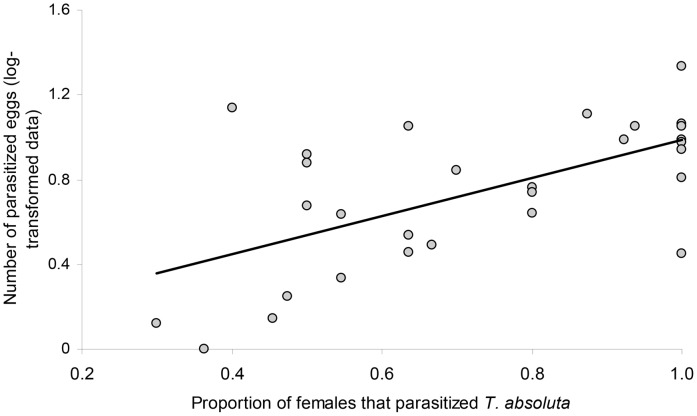
Figure 3. Preference-performance relationship.
Data are presented as proportions of parasitoid females (for a given Trichogramma strain) attacking the host (T. absoluta) under laboratory conditions and the mean numbers of T. absoluta eggs parasitized (log-transformed data) (regression line: y = 0.9001×−0.0856).

