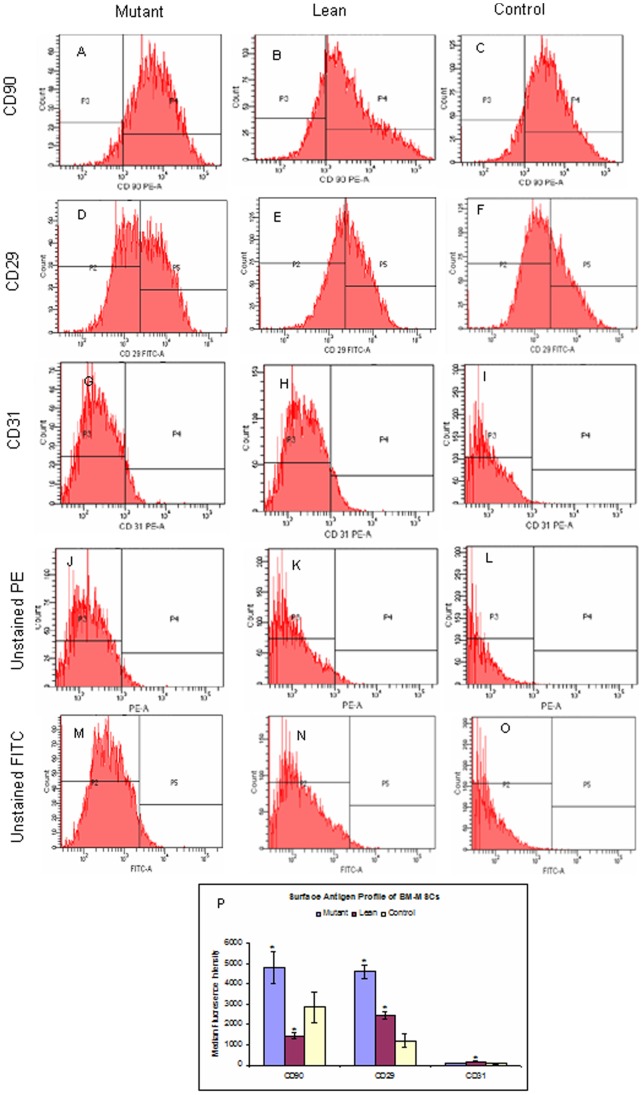
Figure 2. Flow Cytometric analysis of BM-MSCs.
Representative FACS analyses (FACS Diva software, FACS Aria II, BD, CA) of MSCs at passage 3 were positive for CD90-PE (A, B & C) and CD29-FITC (D, E & F) and negative for CD31-PE (G, H & I) demonstrating a mesenchymal phenotype from Mutant, Lean and Control respectively. Panels J, K & L and M, N & O represent the negative controls for PE (CD90/CD31) and FITC (CD29) fluorochromes respectively. Median Fluorescence Intensity (MFI) for CD90, CD29 and CD31 have been indicated in panel P and values have been represented as Mean ± SE (n = 6) from three independent experiments performed in duplicates for each phenotype. Values represented have been normalized against unstained controls for the fluorophore (PE/FITC).

