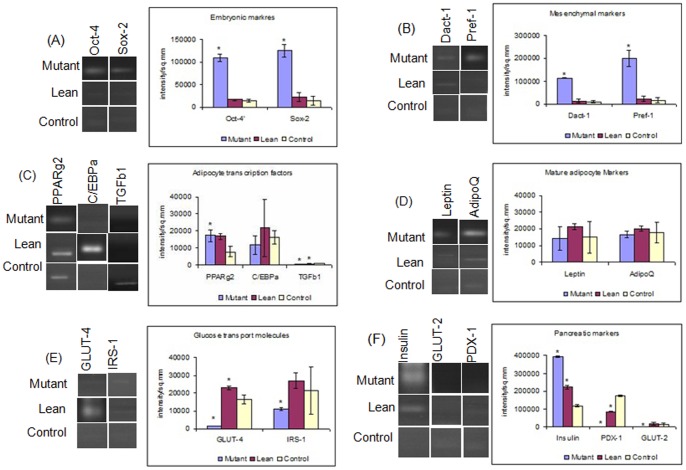
Figure 4. Gene expression analysis of BM-MSCs.
BM-MSCs from Mutants demonstrated an upregulated expression of A) Embryonic (Oct-4/Sox-2 (Embryonic markers), (B) Mesenchymal/Preadipocyte markers (Dact-1/Pref-1) and (C) transcriptional factor (PPARγ2) compared to Lean and Control. However, TGFβ1 showed a decrease (C) and C/EBPα remained the same (C). Mature adipocyte markers Leptin and adiponectin (D) and GLUT-4 and IRS-1 (glucose homeostasis markers) (E) were decreased in Mutant. An upregulated expression of Insulin in Mutant, while PDX-1 and GLUT-2 levels were decreased in Mutant as compared to Lean and Control (F). Quantitative measurements of gene expression were carried out by densitometric analyses using QuantityOne software (BioRad, Italy) and represented graphically by plotting intensity/sq.mm vs gene/phenotype. Values represent Mean ± SE (n = 6) from three independent experiments performed in duplicates. Asteric (*) represents significance (p<0.05 by ANOVA) compared to Control.

