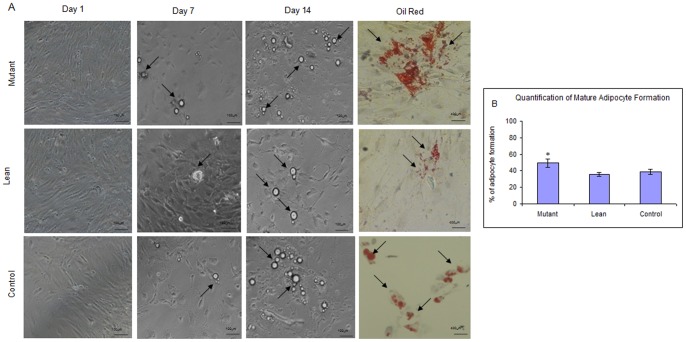
Figure 6. Differentiation of BM-MSCs to form adipocytes.
(A) Morphological changes in MSCs from Mutant, Lean and Control rats during adipogenic induction were visualized under phase contrast microscope (Nikon T2000, Japan) at day 1, 7 and 14 demonstrating the formation of lipid-droplet filled cells (arrows). Adipocyte formation was confirmed by staining with Oil Red O (arrows). Magnifications have been represented using scale bar. Panel B shows the quantification for increase in mature adipocytes formed from Mutant as compared to Lean and Control, using the ACT2U soft ware (Nikon, Japan). Values have been represented as Mean ± SE (n = 6), from three independent experiments performed in duplicates. Asteric (*) represents statistical significance (p<0.05) compared to Control as analyzed by ANOVA.

