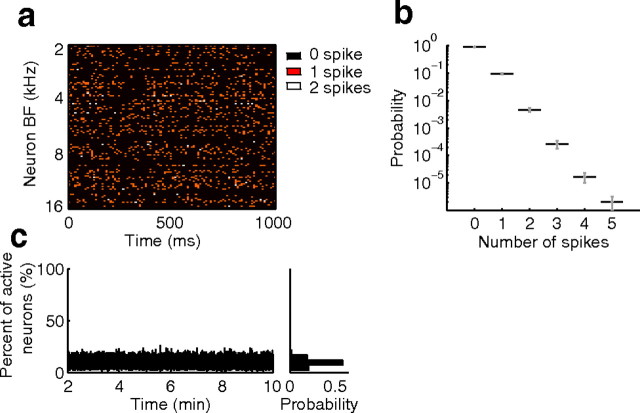
Figure 4.
The population activity is spatiotemporally sparse. a, A 1 s segment of the population dot-raster to the dynamic moving ripple sound is shown with neurons ordered according to best frequency. Most neurons produce zero (black) or one (orange) spike and rarely two spikes are observed (white) per 10 ms sound epoch. As can be seen, the population raster appears to be spatiotemporally uncorrelated. b, The distribution of spikes per 10 ms sound epoch for the entire ICC population. Zero (90%) and one (9.5%) spike are the most common, while >2 spikes rarely occur (0.5%). In c, the population activity fraction (i.e., the percentage of active neurons) is shown as a function of time (10 ms resolution) over the duration of the stimulus. The population activity fraction has a mean of 10% and does not exceed 26%. Ten millisecond epochs were chosen for the analysis because these represent the average integration time for ICC neurons (Fig. 3c).

