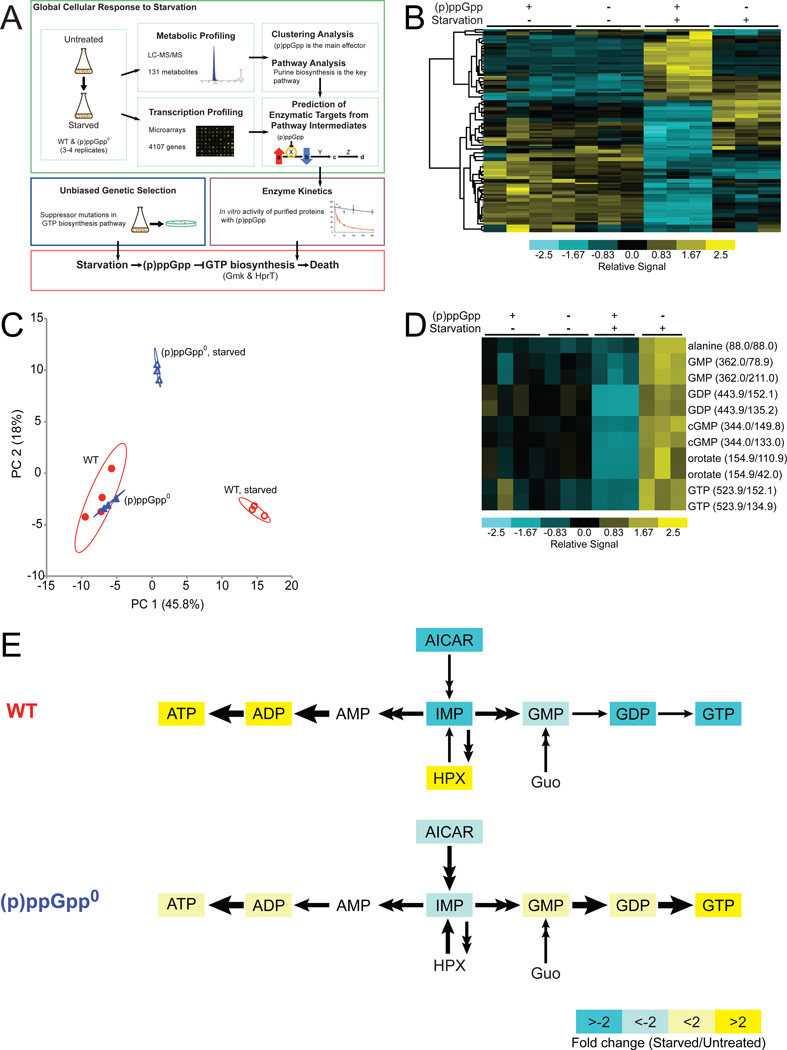
Figure 1. Metabolic Profiling of Wild-type and (p)ppGpp0 Cells upon Amino Acid Starvation.
(A) Discovery of critical direct targets of (p)ppGpp during starvation in B. subtilis. For metabolic profiling, wild-type (WT) and (p)ppGpp0 cells were starved and metabolites were quantified by LC-MS/MS. Changes in metabolite signatures were analyzed to reveal (p)ppGpp as the major effector of the starvation response and to identify purine biosynthesis as significantly altered. To identify targets of (p)ppGpp, the pathway was examined for steps in which levels of a substrate increased while levels of the product decreased. Transcriptional profiling indicated that the identified targets were regulated post-transcriptionally. Predicted targets were assayed for enzymatic inhibition by (p)ppGpp in vitro. In parallel, a genetic screen was performed in (p)ppGpp0 cells, which identified mutations that lower GTP biosynthesis. These results revealed that the crucial function of (p)ppGpp during starvation is to directly inhibit the activities of GTP biosynthesis enzymes.
(B) Clustering analysis of metabolite profiles obtained by LC-MS/MS. Rows correspond to 55 metabolites that display significant changes in WT ((p)ppGpp +) or (p)ppGpp0 ((p)ppGpp −) cells in the presence (+) or absence (−) of starvation. Columns correspond to samples labeled above the heat map; ≥ 3 experimental replicates are shown. Samples and metabolites were hierarchically clustered using Cluster and plotted with TreeView. Metabolite levels are normalized to total ion current (TIC) and are indicated by color: high levels are yellow and low levels are blue. An expanded, annotated view is presented in Figure S1.
(C) PCA analyzes correlations among the metabolite profiles in WT and (p)ppGpp0 samples and identifies independent factors (principal components) that explain the variation between samples. Principal components 1 (PC1) and 2 (PC2) comprise nearly 64% of the total variation. The 95% confidence interval is circled around each sample set.
(D) A cluster is magnified from a complete sub-branch of 1B. Metabolites were quantified by the levels of their daughter ions (1–2 daughter ions), with parent/daughter ion masses indicated.
(E) Starvation-induced changes in the purine biosynthesis pathway. Metabolites with significant changes (q-value < 1% for both daughter ions) in WT and (p)ppGpp0 cells are colored: yellow and blue indicate increased and decreased levels, respectively; white indicates no significant change. HPX: hypoxanthine, Guo: guanosine.

