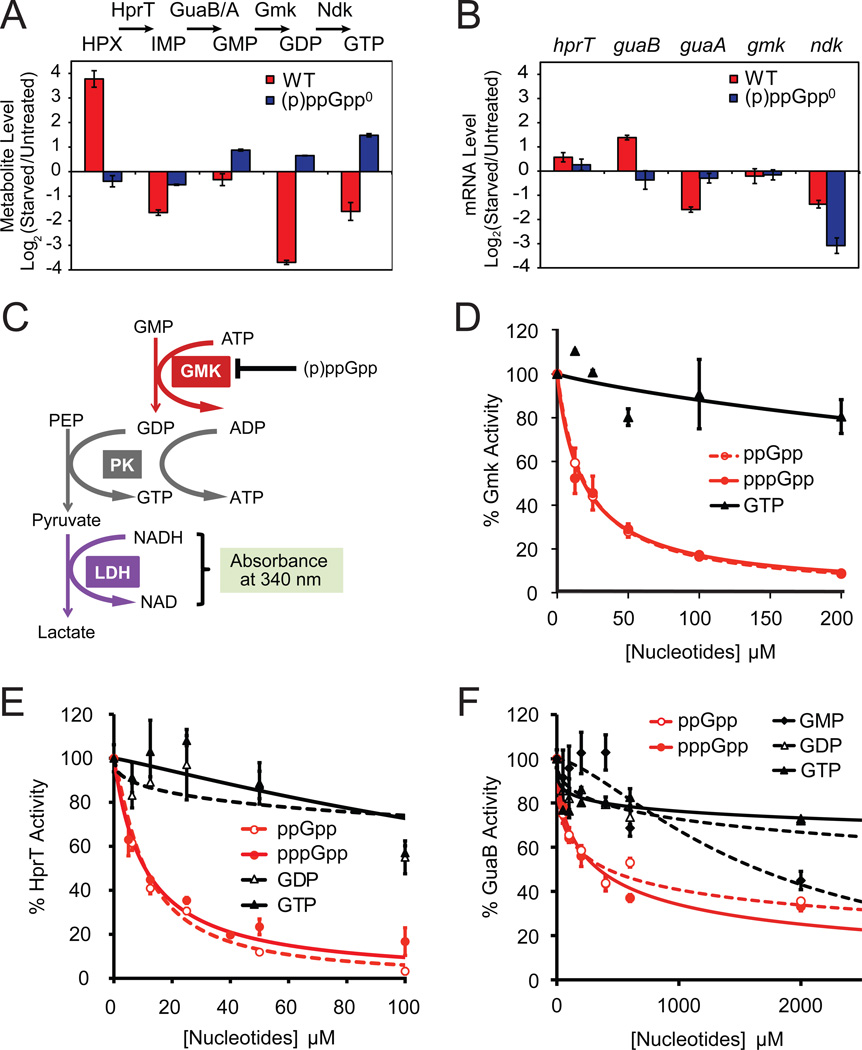
Figure 2. (p)ppGpp Directly Inhibits Multiple GTP Biosynthesis Enzymes.
(A) Quantification of LC-MS/MS data suggests that upon starvation, conversions from hypoxanthine (HPX) to IMP (by HprT) and from GMP to GDP (by Gmk) are blocked in WT but not (p)ppGpp0 cells. Log2 ratios of metabolite levels between starved and untreated samples are plotted. Red: WT; blue: (p)ppGpp0 cells. One daughter ion is used for calculation; nearly identical results were obtained from the second daughter ion (not shown). Error bars = standard error (n ≥ 3) for this and all subsequent figures.
(B) Microarray-based profiling shows that mRNA levels of hprT and gmk are not down-regulated by starvation. Log2 ratios of mRNA levels between starved and untreated samples are plotted. Red: WT; blue: (p)ppGpp0 cells.
(C) Schematic of the in vitro three-step coupled assay for Gmk enzymatic activity. PK: pyruvate kinase, LDH: lactate dehydrogenase, PEP: Phospho(enol)pyruvate.
(D) (p)ppGpp potently inhibits the enzymatic activity of Gmk in vitro. Gmk activity was measured with 10 nM Gmk, 4 mM ATP, 1.5 mM PEP, 150 µM NADH, 2U PK, 2.64U LDH, 50 µM GMP. The relative activity (V0 with inhibitors / without inhibitors) is plotted as a function of concentration of the indicated nucleotide inhibitors. V0 is obtained as in Figure S2C.
(E) (p)ppGpp potently inhibits B. subtilis HprT activity in vitro. HprT activity was measured with 20 nM HprT, 50 µM guanine and 1 mM PRPP, and plotted as a function of concentration of the indicated inhibitors. V0 is obtained as in Figure S2D.
(F) (p)ppGpp and GMP modestly inhibit GuaB activity in vitro. GuaB activity was measured with 50 nM GuaB, 400 µM IMP, and 2.5 mM NAD, and plotted as a function of concentration of the indicated inhibitors. V0 is obtained as in Figure S2E.

