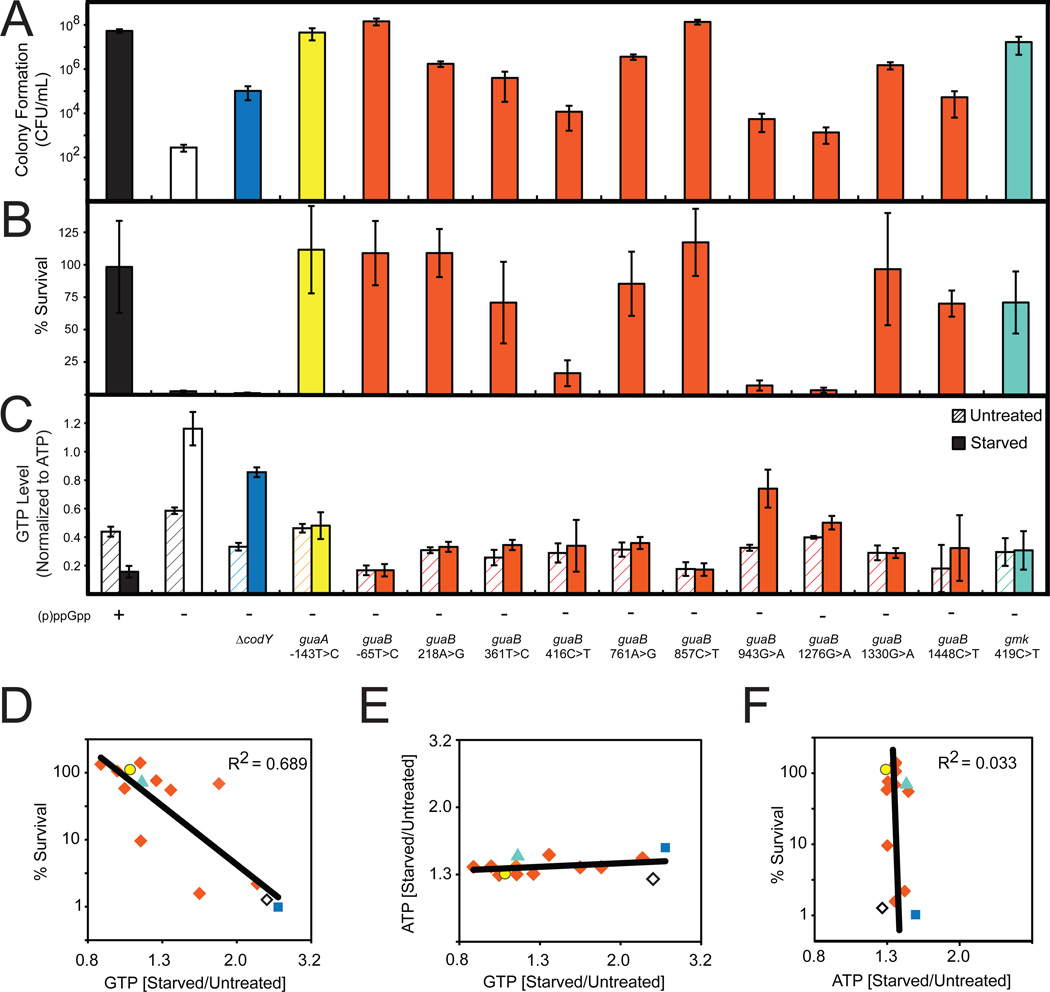
Figure 5. Decreased GTP Levels Allow Survival of Amino Acid Starvation.
(A) Colony formation of WT ((p)ppGpp +), (p)ppGpp0 ((p)ppGpp −) and the indicated suppressor mutants on minimal medium. For this and subsequent panels, the colors denote the different genes that have mutations in the (p)ppGpp0 suppressors and are coded as in Figure 4D.
(B) Percent survival of WT, (p)ppGpp0, and the indicated suppressor mutants upon amino acid starvation. Cells were treated with 0.5 mg/ml RHX for 40 minutes and then plated on LB. Percent survival was calculated as in Figure 4A.
(C) GTP levels of WT, (p)ppGpp0, and the indicated suppressor mutants before and after treatment with 0.5 mg/ml RHX for 10 minutes were quantified by TLC and normalized to initial levels of ATP.
(D) GTP levels are correlated with survival of amino acid starvation. Starvation-induced changes of GTP levels in the indicated suppressor mutants were obtained by TLC and plotted against % survival. Averages from three independent experiments are plotted for each suppressor allele. To assess correlation, the coefficient of determination (R2 value) was calculated. Strains are color coded as in Figure 4D. ◇: (p)ppGpp0; ■: codY, ○: guaA, ◆: guaB, and ▲: gmk suppressor alleles.
(E) Starvation-induced changes of GTP levels of the indicated suppressor mutants are plotted against changes of ATP levels, similar to Figure 5D.
(F) Starvation-induced changes of ATP levels of the indicated suppressor mutants were obtained by TLC and plotted against % survival, similar to Figure 5D.

