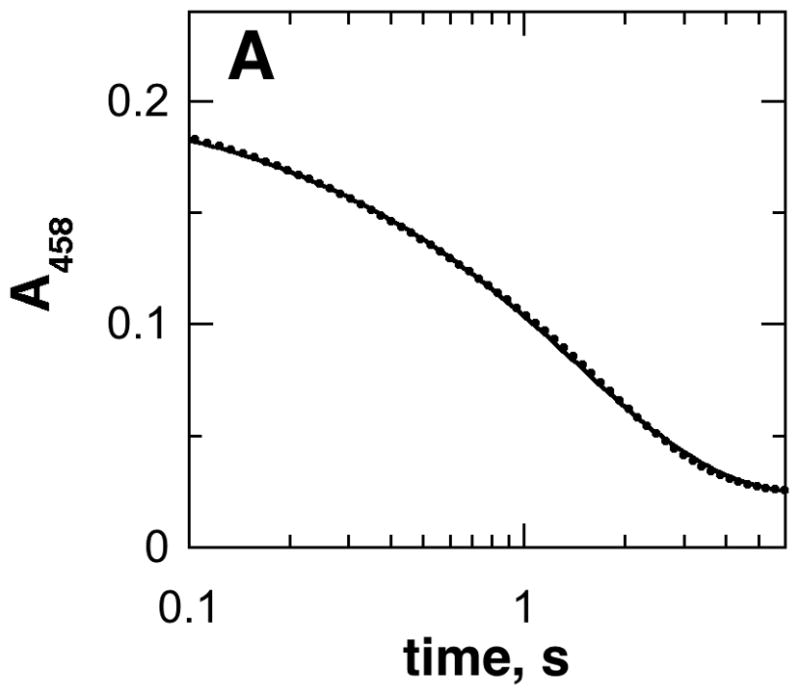
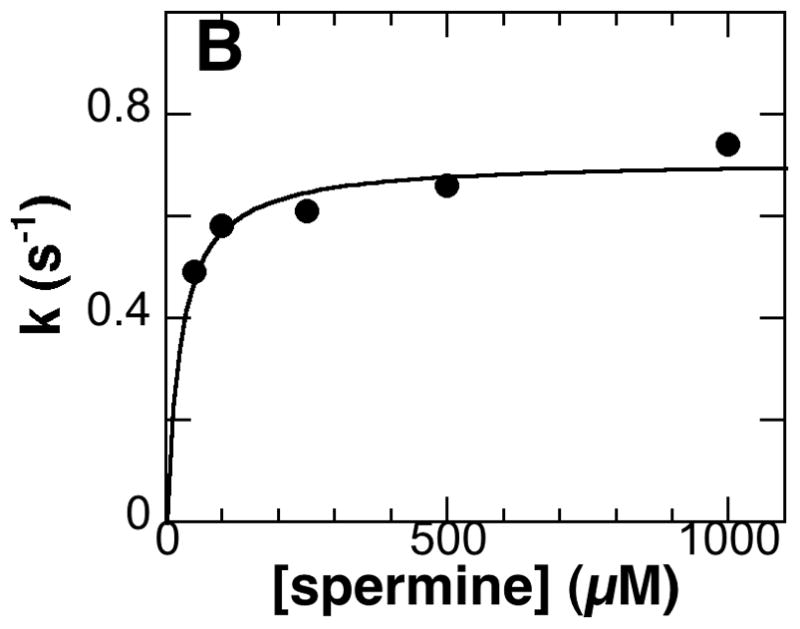
Figure 3.


A, Spectral changes at 458 nm during reduction of PAO by spermine in 200 mM CHES, pH 9.0, 30 °C. (Only 20% of the points are shown for clarity.) The line is from a fit to eq 5. B, Dependence of the flavin reduction constant (kred) on the spermine concentration for the wild-type enzyme. The line is from a fit of the data to the Michaelis-Menten equation.
