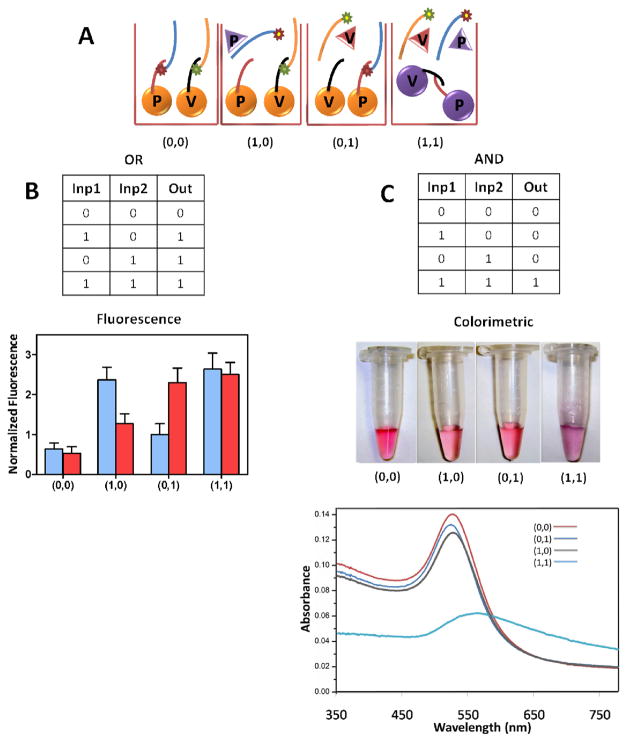
Figure 1.
(A) Various input conditions followed during the experiments applicable to both logic systems. (B) Results for each path of the OR gate (see OR truth table) characterized by fluorescence spectroscopy (blue bars: FITC signal and red bars: TAMRA signal). (C) Results of the AND gate (see AND truth table) visualized in the photograph of the Au nanoparticle solutions and their respective UV-Vis extinction spectra. (Target proteins; PDGF=VEGF=200 nM)

