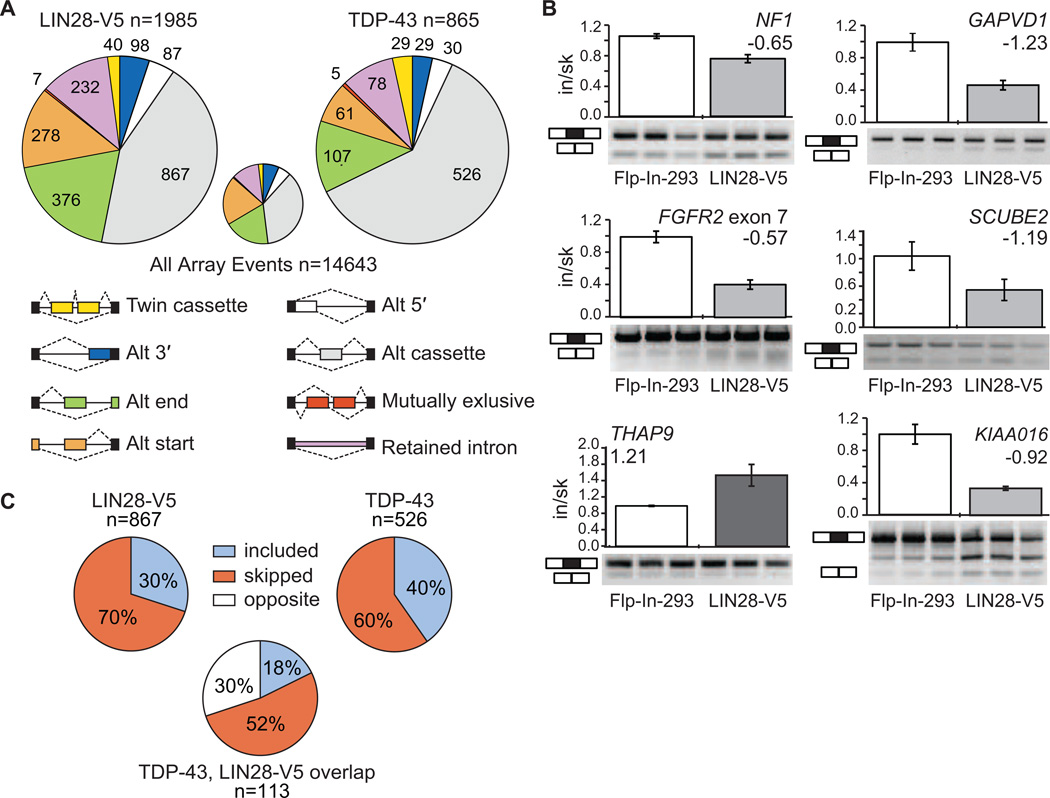
Figure 6. LIN28 expression in somatic cells results in thousands of alternative splicing events, in part through regulation of TDP-43 levels.
(A) The pie charts display the number of each type of alternative splicing event changed upon overexpression of LIN28-V5 (left) or TDP-43 (right) in Flp-In-293 cells, as detected by splicing-sensitive microarray analyses. The small pie chart (center) represents the distribution of alternative splicing event types detected on the microarray. (B) RT-PCR validations of alternative cassette events detected by microarray analysis. All plots show significant differences between control Flp-In-293 and LIN28-V5 293 cells (p < 0.05, Students t-test). Bars represent an average and error bars represent the standard deviation across biological triplicates. (C) The percent of included versus skipped alternative cassette exons upon overexpression of LIN28-V5 (left) or TDP-43 (right) in Flp-In-293 cells. For the alternative cassette exons that changed in both conditions (n = 113), the percent of exons affected in the same (where the exon is included or skipped in both conditions) or opposite direction are shown below.

