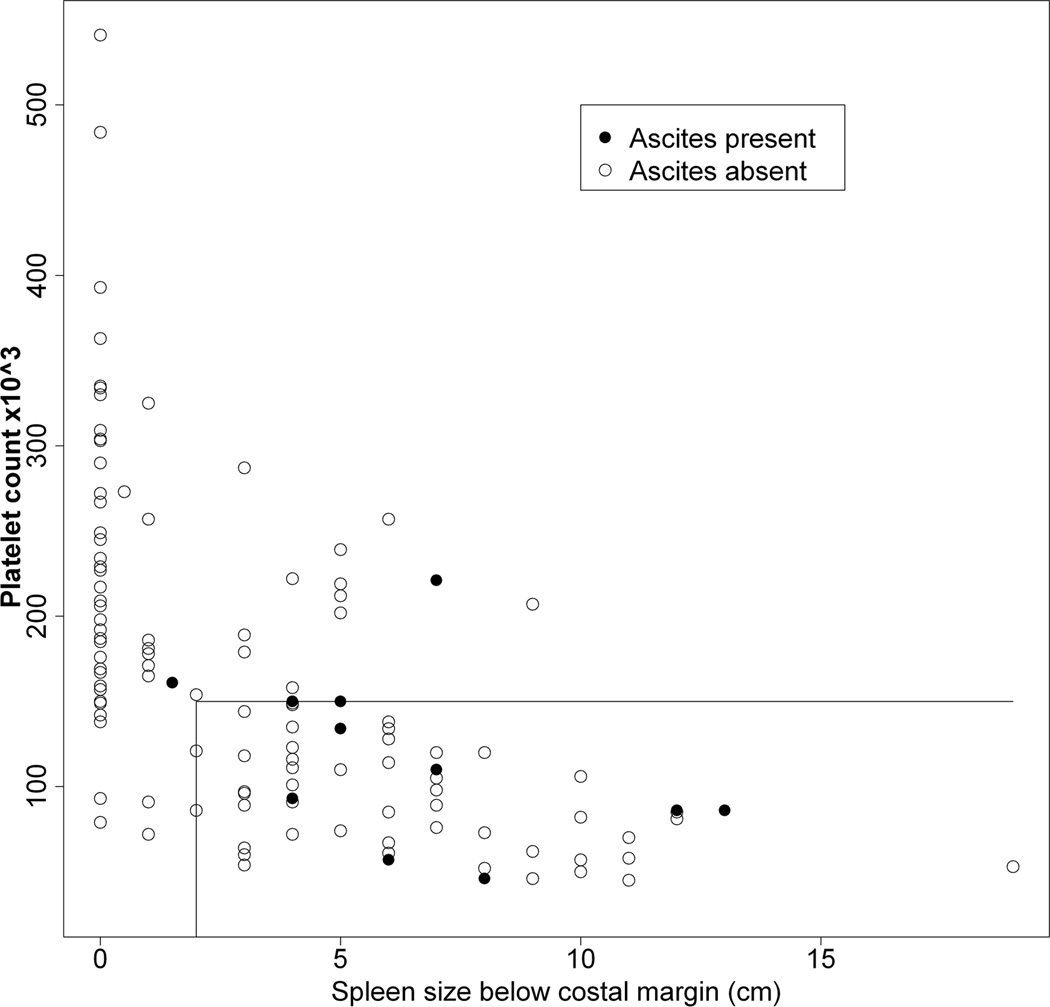
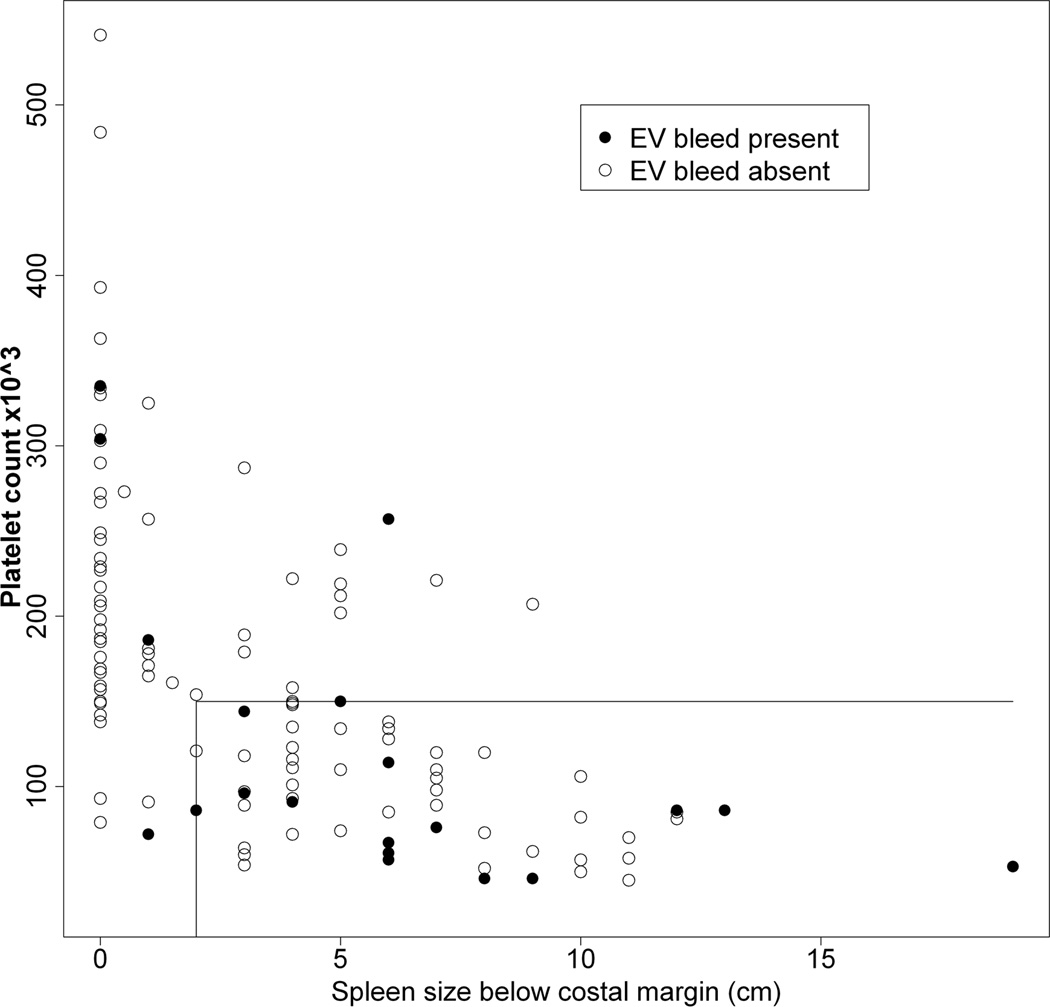
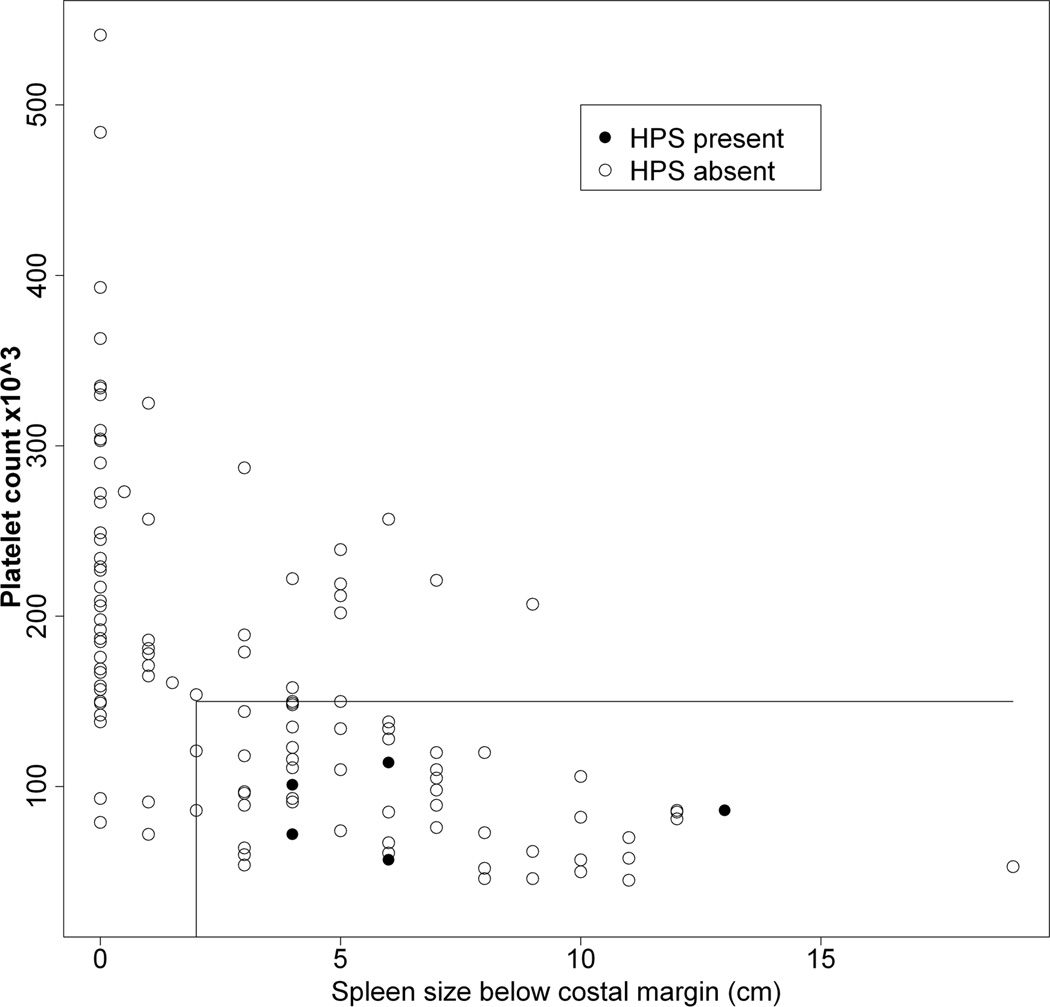
Figure 3.
A–C: Correlation of history of presence of ascites (3A), esophageal variceal bleed (3B) or hepatopulmonary syndrome (3C) with current platelet count and spleen span below the costal margin. The presence (filled circles) or absence (open circles) of a history of ascites (3A), EV bleed (3B) or HPS (3C) for each subject relative to platelet count (y-axis) and spleen size (cm below the costal margin, x-axis) is shown. The horizontal line represents a platelet count of 150,000, and the vertical line a spleen size of 2 cm below the left costal margin. Thus, individuals whose data points fall to the right of a spleen size of 2 cm (x-axis) and below a platelet count of 150,000 (y-axis) are in the definite PHT category. Note that a large majority of subjects with complications fall within this part of the graph.


